
Report Summary
Technical education frequently evolves to serve new frameworks, languages, and workflows. As a service to the education community, every year we release the GitHub Education Classroom Report. This year, we surveyed around 7,000 students and over 100 educators to build upon our previous data collection from 2019, 2018, and 2017.
This report has key insights into the student developer toolchain, how students are learning real-world workflows, and expectations around technical coursework. We offer this information to faculty looking to augment their instruction, or learn from the choices of other instructors.
Tl;dr - Key Findings
- Pay attention to APAC and LATAM. The number of respondents from those areas rose from 2019-2020.
- The next generation of developers will know and use Python. Adjust your stack, product development, and outreach accordingly.
- Browser-based tools are growing in popularity for small, discrete tasks.
- Younger developers will expect their potential workplaces to offer remote work (and use GitHub).
- Visual Studio Code is the number one choice of younger developers, for the second year in a row.
- For remote classrooms, faculty report struggling with student engagement and monitoring student progress.
At the same time we wanted to report insights that were more urgent and timely: how have teachers responded to remote classwork? How has their classroom practice changed, and how might we make tools to support this new context?
We also expanded our area of inquiry to include the path to work: internship application patterns, rates of employment, and workplace expectations. While GitHub Education is not focused on recruiting, we are keenly interested in onboarding students to opportunity: we want to help students learn and earn. Partners in our ecosystem, or those looking to hire young talent, can use these insights to connect with younger developers.
It's worth noting that all of this data is self-reported. Further research would be required to compare reported usage and metrics against usage patterns. If you would like to use this data for our own research, you will find the anonymized data set at the GitHub Education repository under an MIT License.
Who we spoke to
Around 1.13 million students belong to GitHub Education programs, and many elect to receive email updates from the team. Of those, 7,070 students and 165 faculty responded to our survey.
We know that these individuals are students and faculty because when they “join” GitHub Education, we verify their academic status to offer key benefits. For students, those key benefits last two years. This survey reached out to students (and former students) who joined GitHub Education in 2014, 2015, 2016 and 2017. We selected this segment to build upon our knowledge base from 2019, and to learn more about the experience students have in transitioning from school to industry.
Age of student (and former student) survey respondents
| Year joined GitHub Education | 2014 | 2015 | 2016 | 2017 |
|---|---|---|---|---|
| % of survey respondents | 14.3% | 16.1% | 28.3% | 41.3% |
| Average Age | 28.2 | 26.9 | 25.3 | 24.1 |
The gender of survey respondents, for both faculty and students, remained consistent from last year's report.
Gender of student and faculty respondents
| Female | Male | Non-binary | Prefer to self-describe | |
|---|---|---|---|---|
| Students | 8.3% | 89.8% | 1.3% | 0.6% |
| Teachers | 6.8% | 92.6% | 0.7% | 0% |
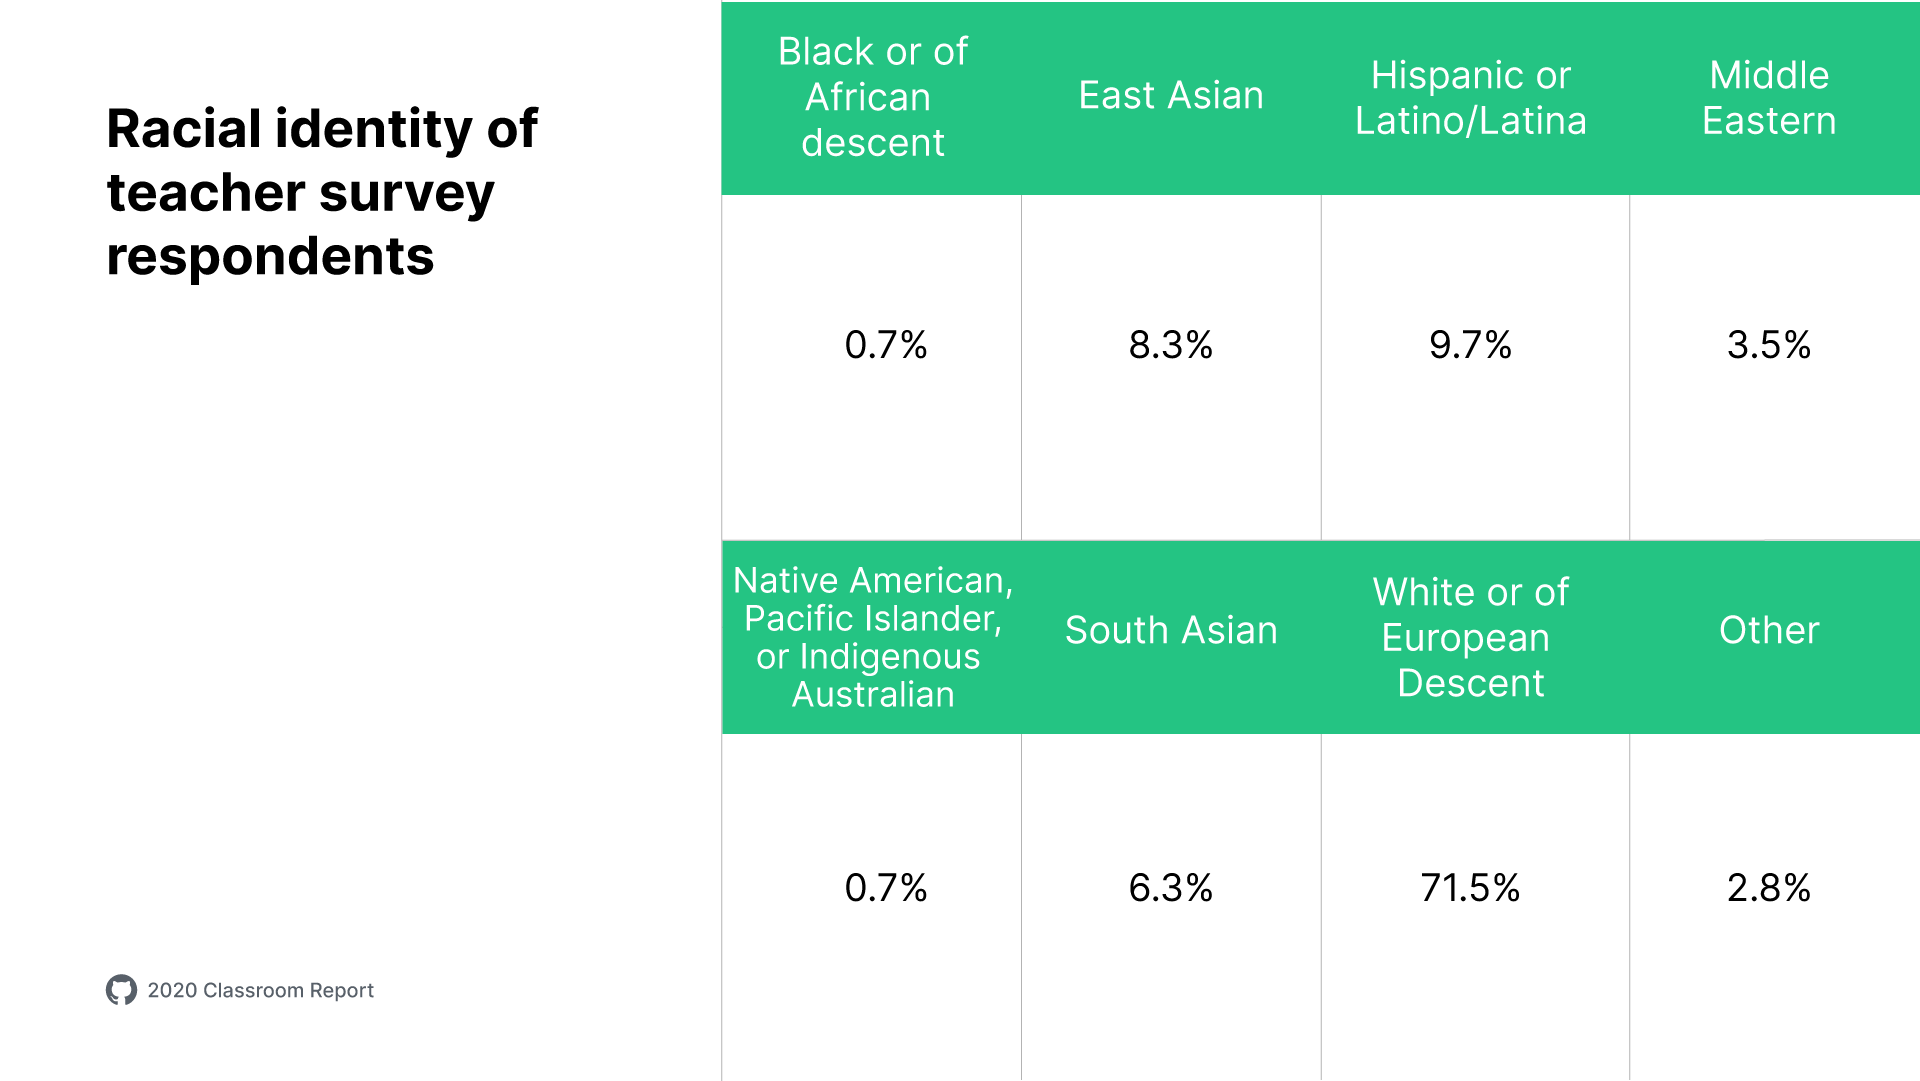
Racial identity of student and faculty respondents
Students and faculty self-reported their race and ethnicity, with the ability to select multiple responses. Faculty self-report as predominantly white, and by a greater margin than previous data (71.5% in 2020 to 55.6% in 2019).

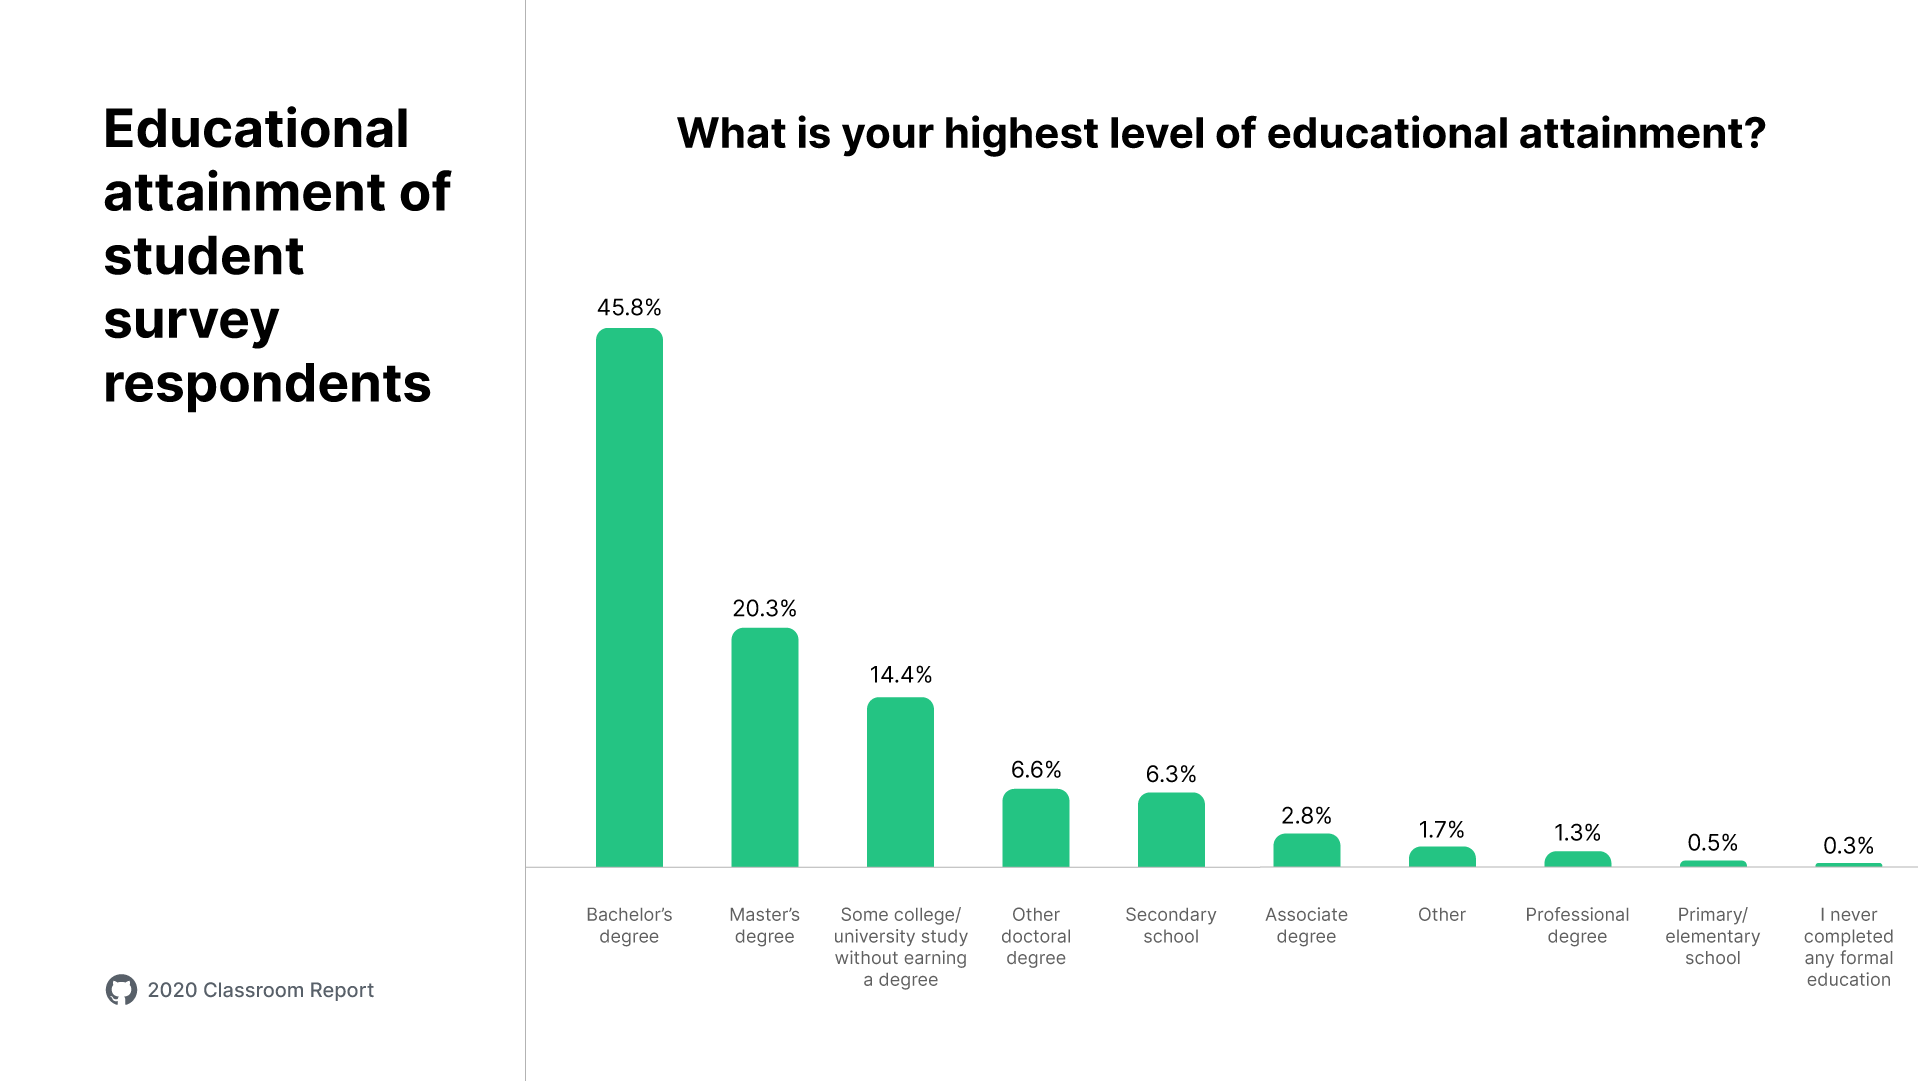
Since respondents joined GitHub Education anywhere from 3 to 6 years ago, it is not surprising that they are well along in their academic careers. Overall, 45.8% report earned a bachelor's degree, 20.3% report earned a master's degree, 6.6% earned a doctoral degree, and the remaining respondents responded with a variety of other educational attainments.
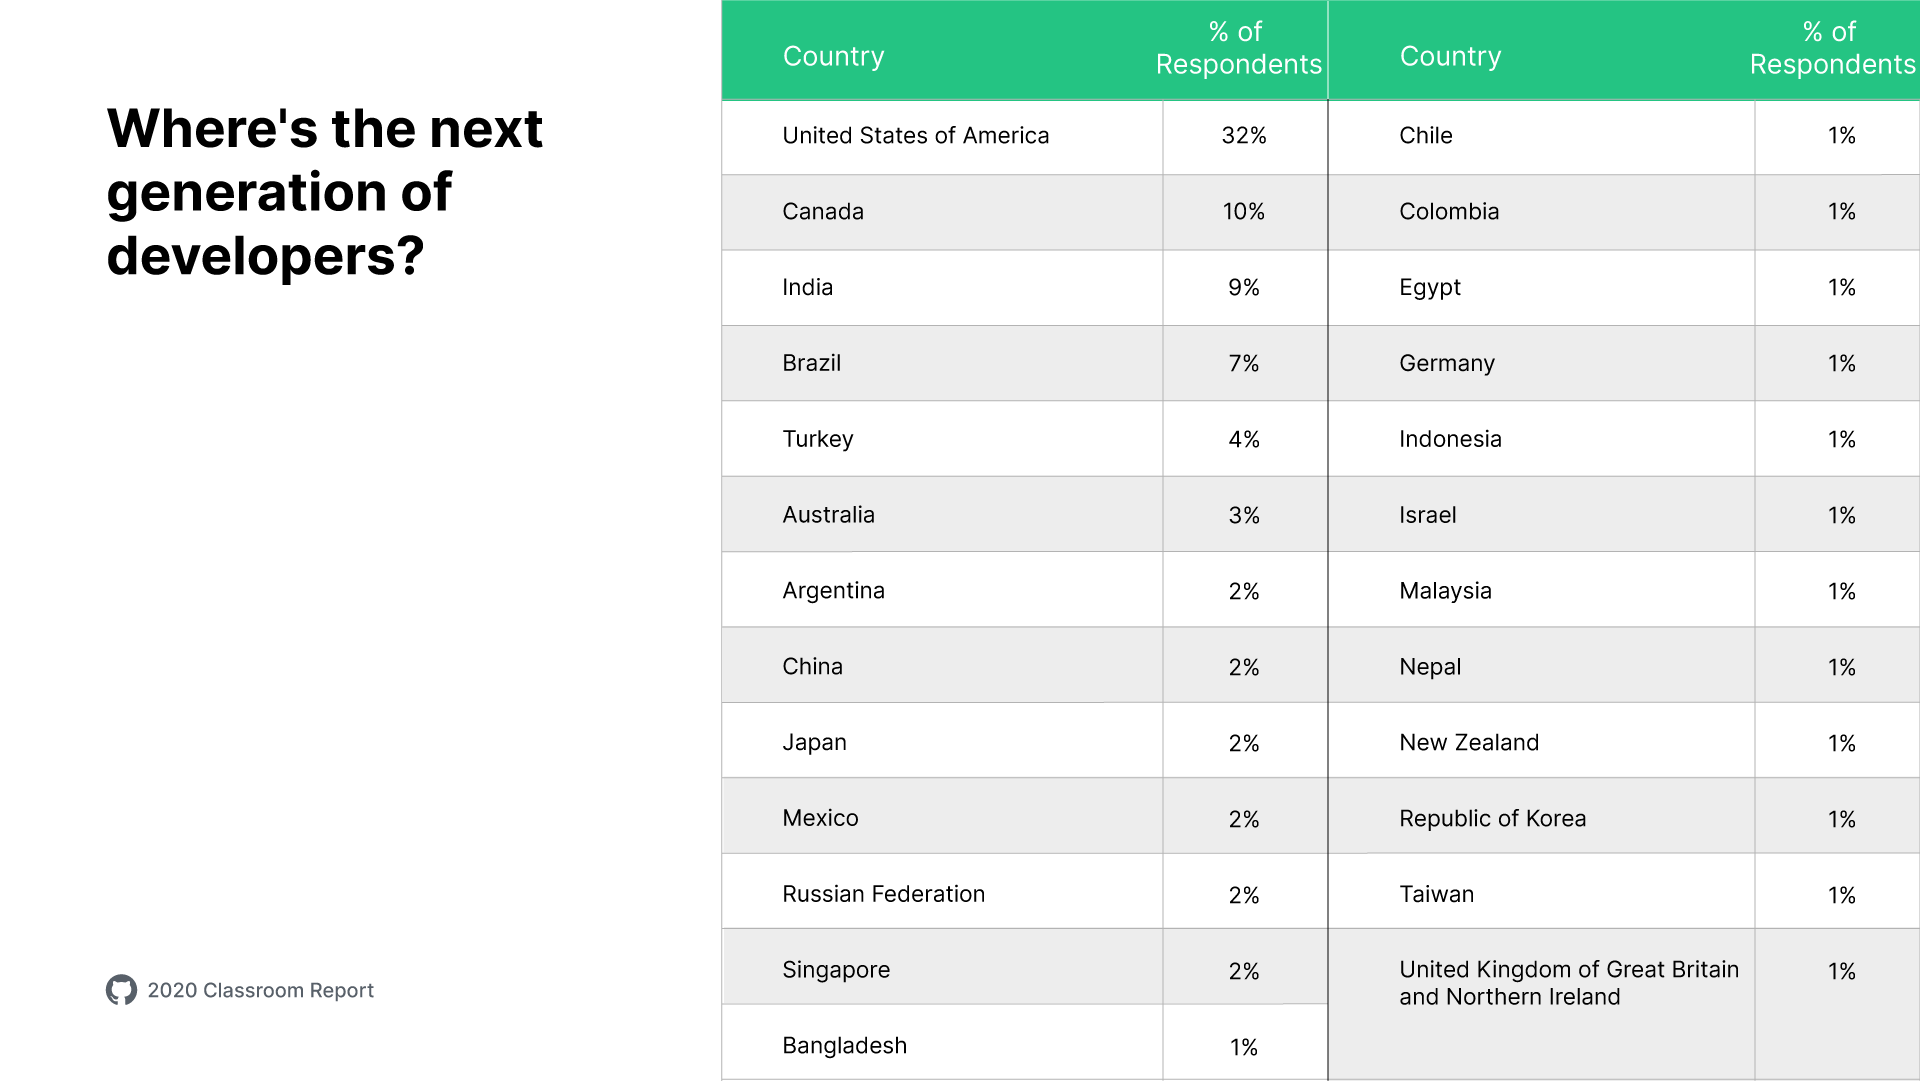
Where the developers are
In our 2019 report, 50% of student developers hailed from the United States, which dropped to 33% this year. We saw more respondents from Canada (10% v. 1.9%) and India (9% v. 6.74%). While we can't explain the rise in Canadian respondents -- we hear Mona is big in Vancouver -- the growing developer population in the Asia Pacific region (APAC) has been documented.
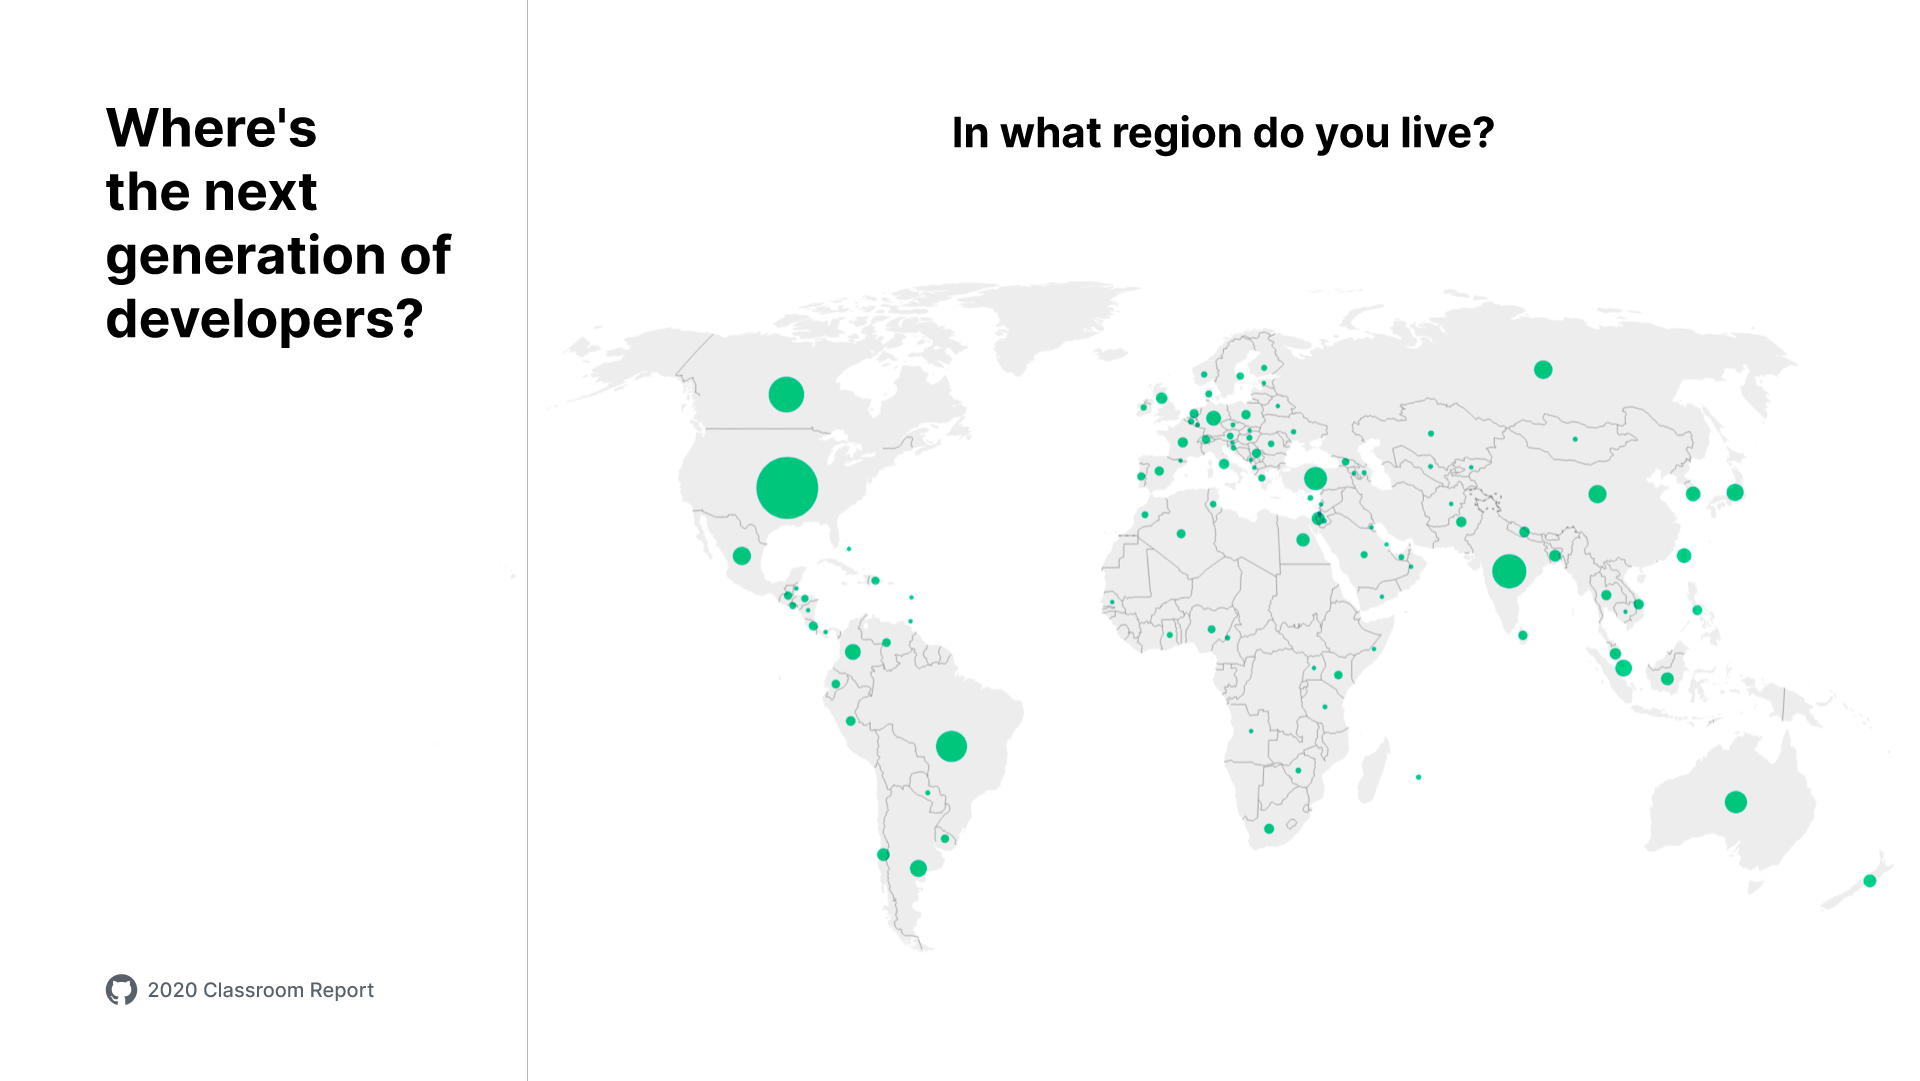
The Evans Developer Population and Demographic Study of 2019 pointed to APAC as being home to the youngest, and fastest-growing, developer population.
APAC has the largest population of younger developers among the regions. A little less than 3 million are under the age of 30, which is more than quadruple the number of developers under 30 in North America.
13% of respondents this year hail from Latin America, versus ~10% in 2019, which also matches Evans' projections:
In 2019, Latin America's developer population is approximately 2.16 million, and it is projected to grow at an average rate of 3.6% over the next five years.
With developer populations growing at faster rates in APAC and LATAM, consider hiring developers remotely in these areas. Hiring remotely is another way to introduce diversity into your workforce.
What the developers use
From our previous research into Git and GitHub adoption in the workplace, it's clear that the tools students learn to use in school often travel with them to work.
Companies who make developer tools are eager to know what younger developers prefer, and how advancements--for example, in cloud computing, processing power, or connectivity--might affect their behavior.
One consistent finding, across the board, is the widespread adoption of Python and related tooling. In the past five years, many, if not most, of the top computer science programs in the United States have implemented Python as a primary language of instruction.
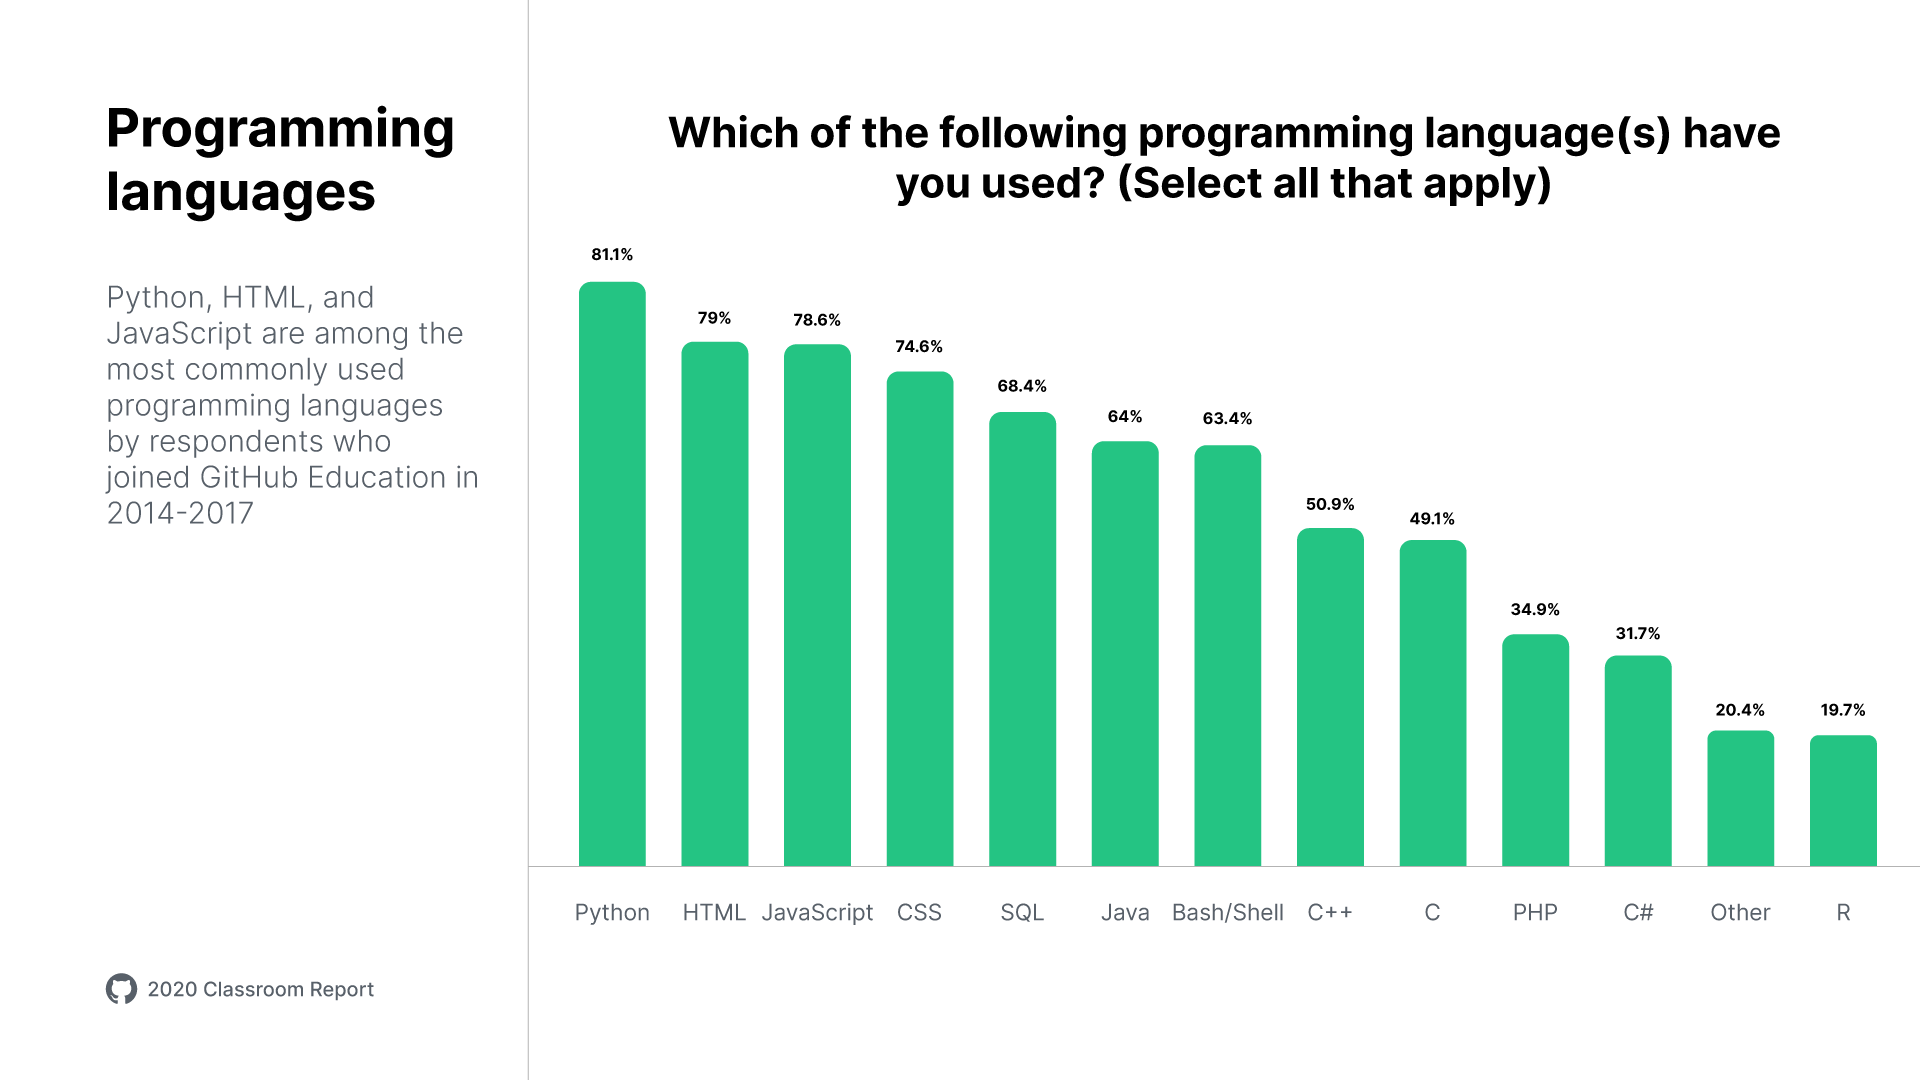
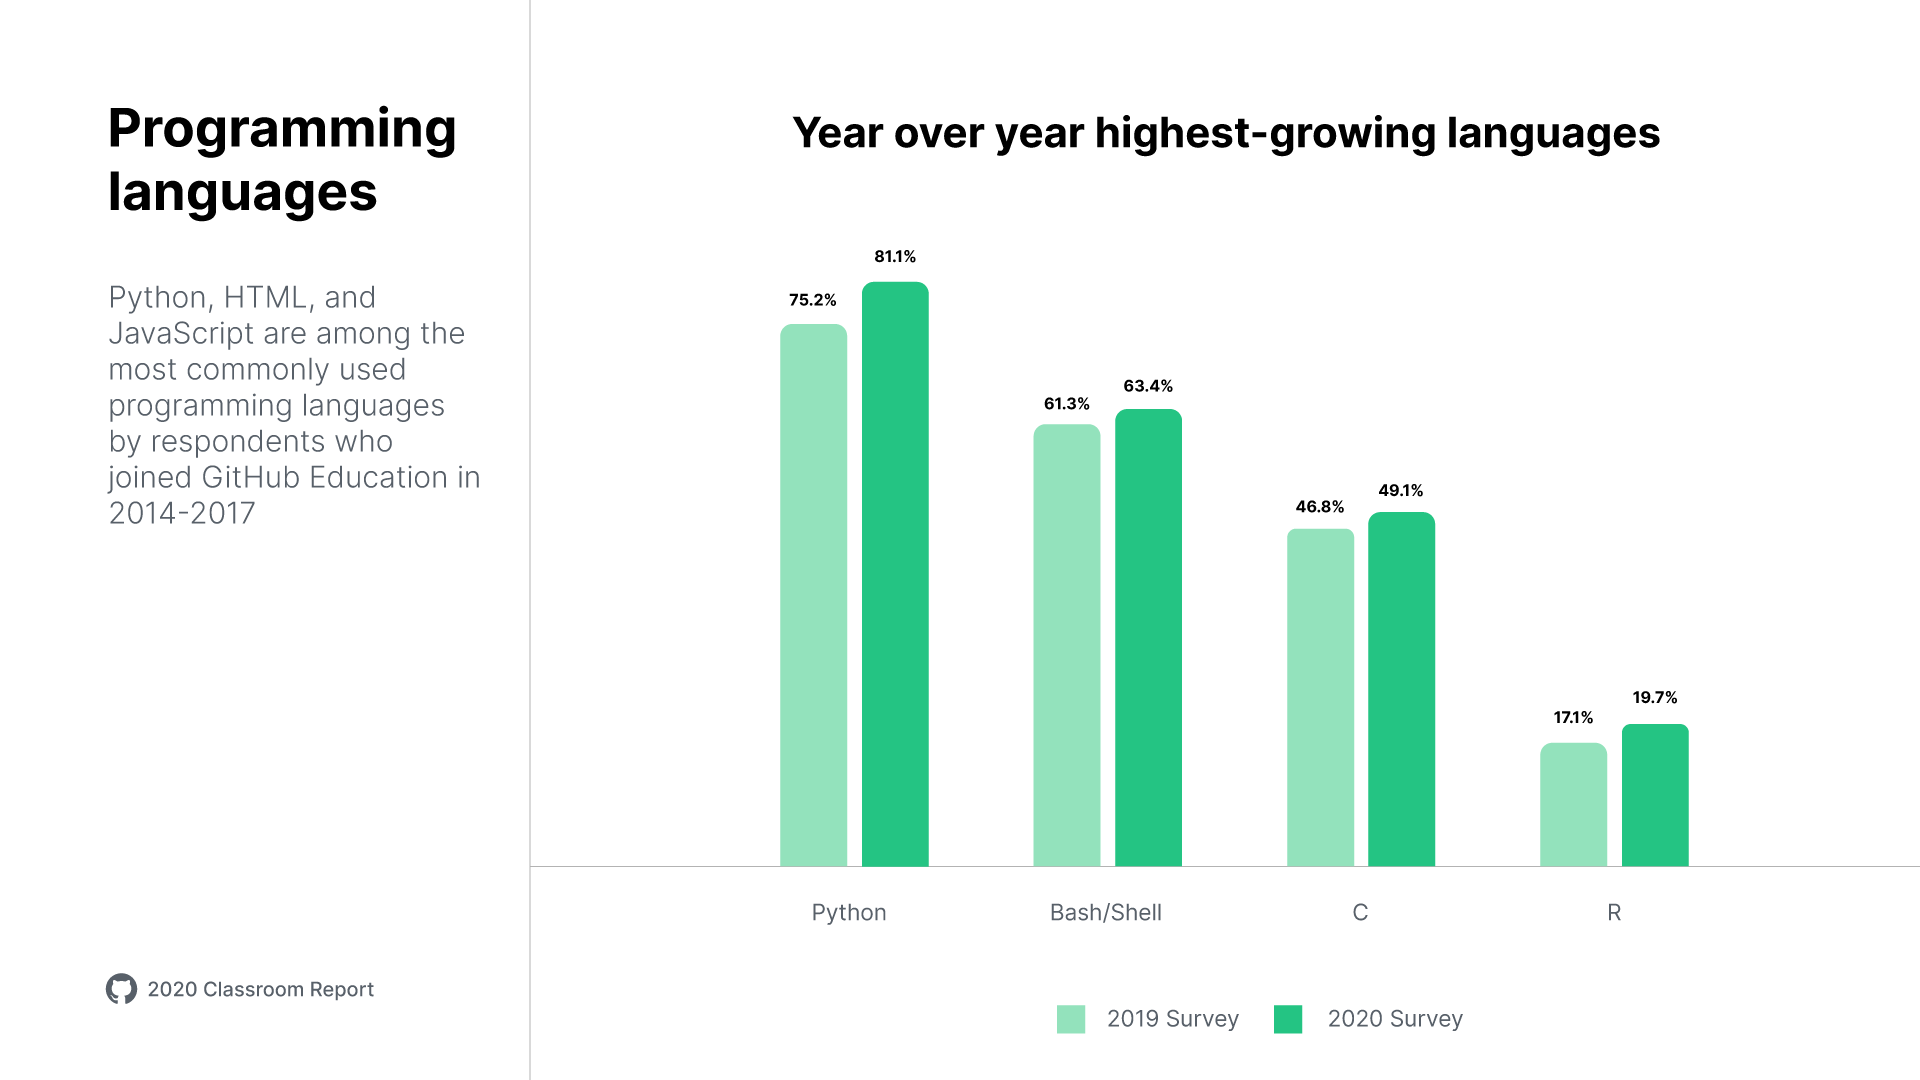
Here at GitHub, we expect to see this trend continue: Python has applications across different domains, like data science, which makes it a suitable choice for instruction. Faculty members who want to invest in tools that students can grow with will likely continue to choose Python and related tooling.
More students than ever will come out of school with Python as their first language. This is great news for organizations that leverage related tooling (such as TensorFlow) but may require retraining new hires if you have a different stack.
The Developer Toolchain
These early-career developers developers report using 2-3 tools as part of their workflow, including integrated development environments (IDEs). IDEs exist to support the developer, to bring about efficiency and creativity as they write, refractor, or review.
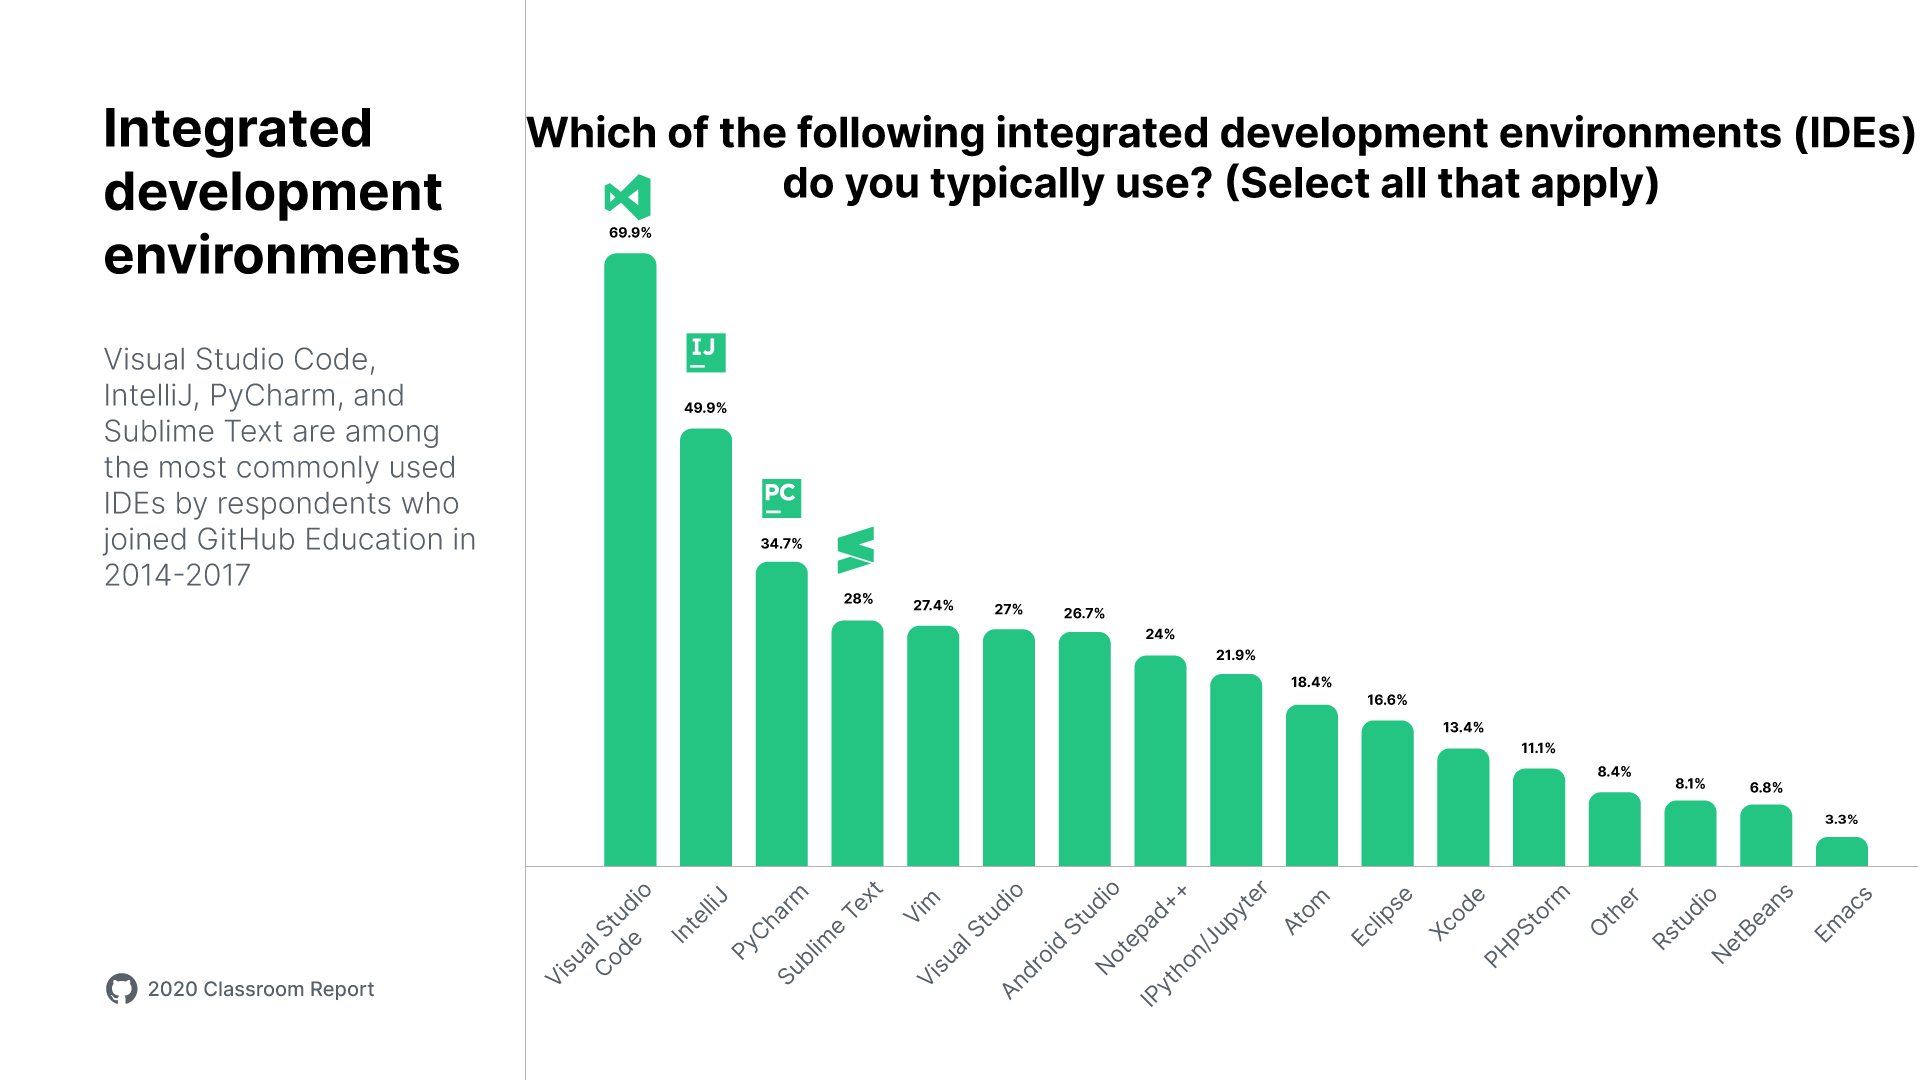
Visual Studio Code continues to be the number one choice among early-career developers, growing on the usage pattern from 2019. Here are a few of the larger trends in IDE usage from 2019-2020.
| Visual Studio Code | IntelliJ | PyCharm | SublimeText | |
|---|---|---|---|---|
| 2019 | 52.5% | 29.8% | 19.8% | 32.4% |
| 2020 | 69.9% | 49.9% | 34.7% | 28.0% |
* Students could choose more than one option, so percentages do not total 100%
We've seen the wide adoption of editors that give developers superpowers--Visual Studio, IntelliJ and PyCharm among them. While minimalist text editors like Notepad++ or Vim are unlikely to leave the developer toolbelt any time soon, more and more developers are looking to online editors to make quick changes.
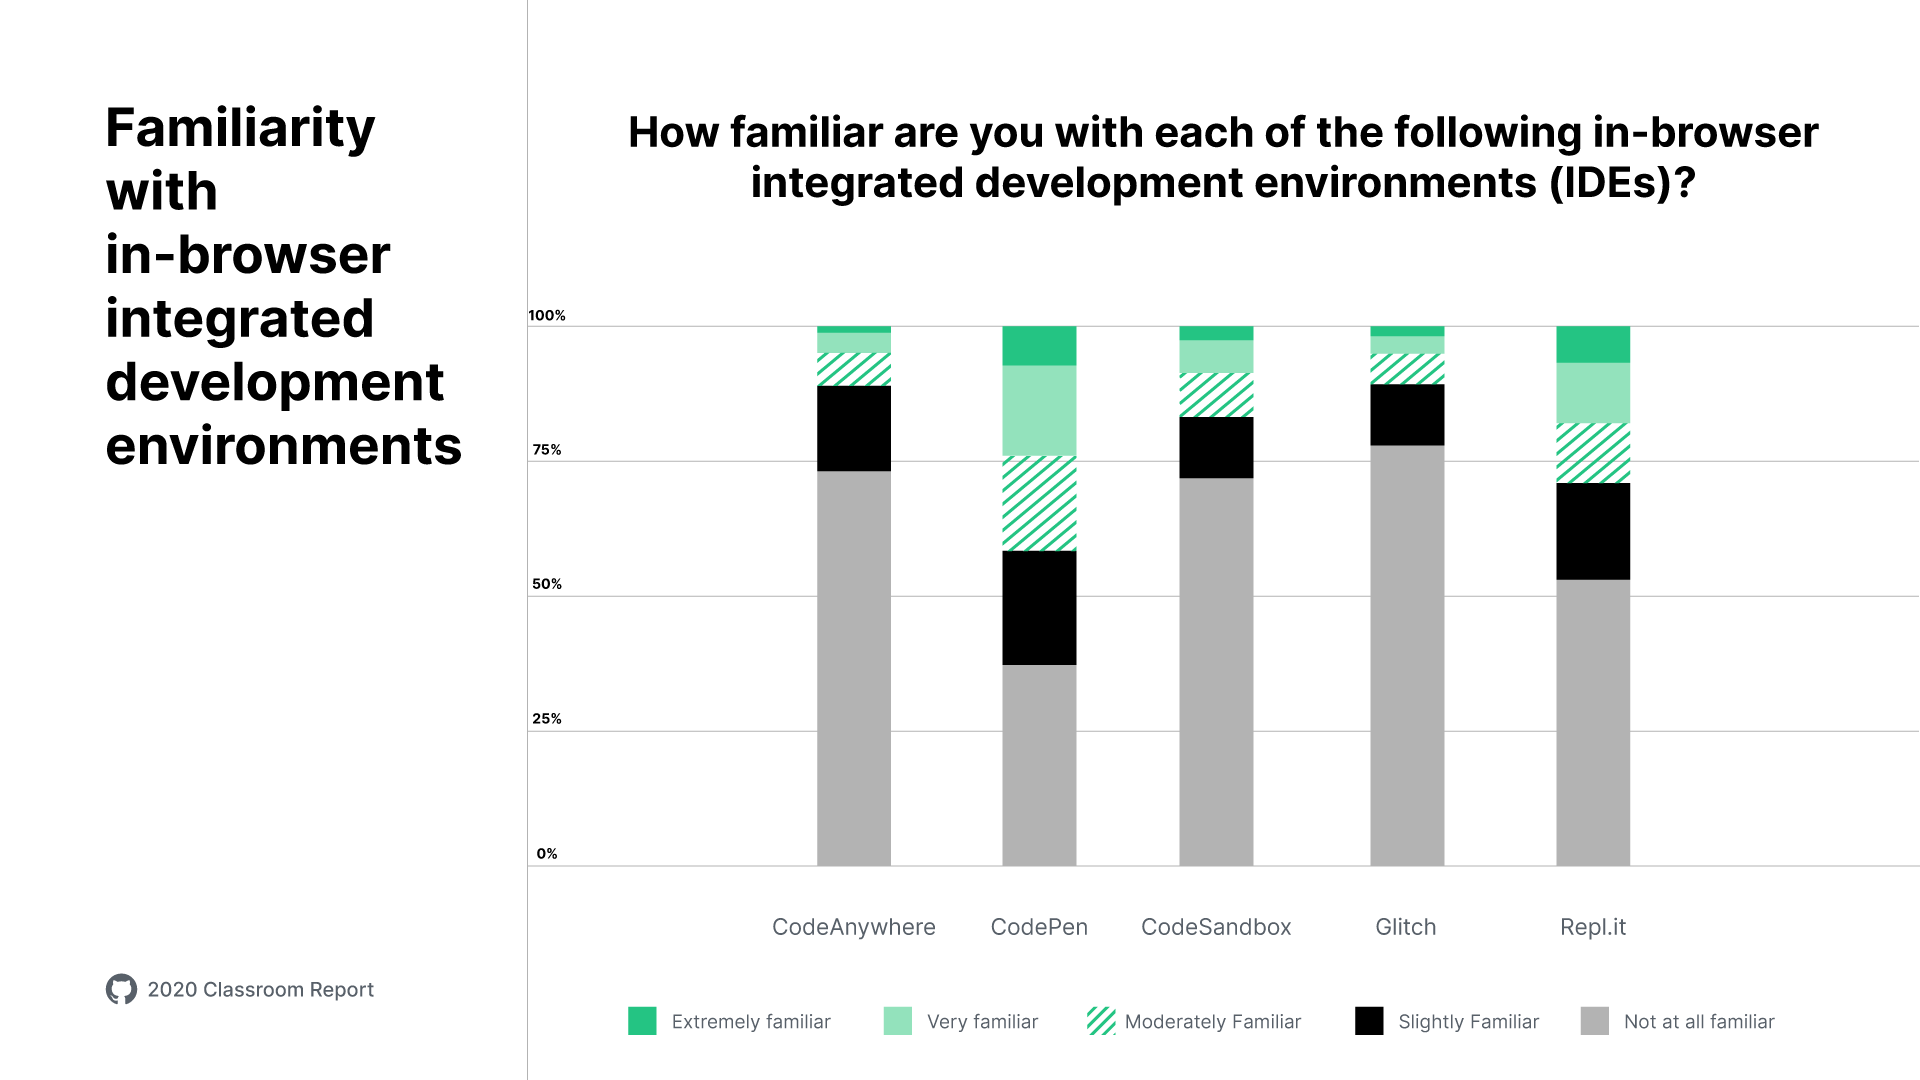
In fact, almost 40% of early-career developers we surveyed have used browser-based developer tools, such as repl.it, Codepen, and Code Sandbox.
When asked about why they use browser-based tools, younger developers point towards ease of use and the low barrier to engage. Some of the top benefits are:
- Speed.
- “If I need to quickly test something or prototype something, it's nice to have an easy, separate environment.”
- “Only for quick code snippet testing.”
- Reviewing small segments of a codebase.
- "To test small codes and help some friends at college.”
- Low barrier to engage with the code.
- “Easy to share with others, and avoids overhead with installing dependencies. Mostly used to test out examples.”
- Collaboration and sharing.
- “Because I'm editing someone else's shared code.”
- "To share small pieces of code or to test some code online without having to prepare my computer.”
When asked how often they use in-browser tools, only a small subset of Codepen and repl.it users say “frequently” or “always.” Younger developers may prefer their desktop applications, configured to their liking, for longer projects or periods of time.
Preferences for both powerful IDEs and online editors for small, discrete tasks, suggest two “modes” of development: a robust, configurable state for concentrated flow, and an easy, lightweight state for collaboration and review.
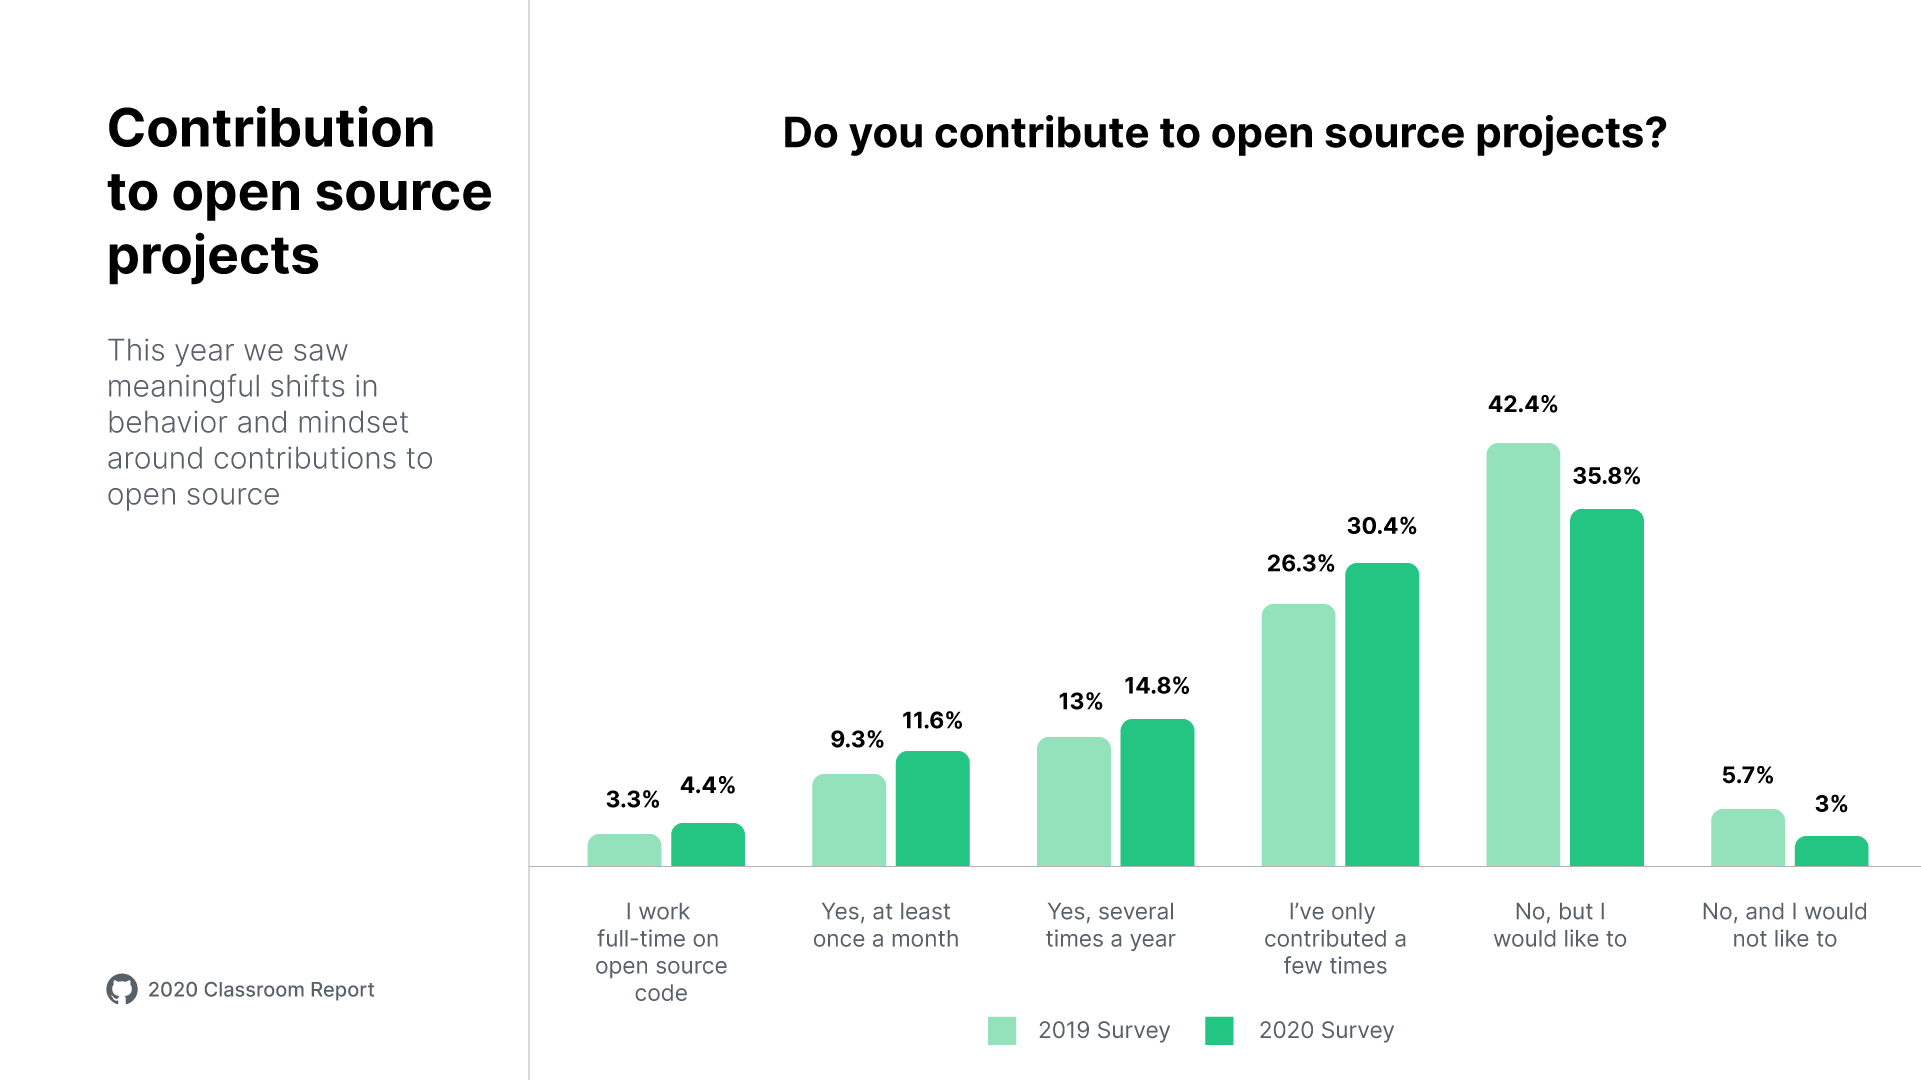
Contribution to Open Source Projects
When evaluating resumes, engineering managers at GitHub tell us they like to see contributions to open source projects. Why? Because they are examples of effective collaboration, working on an existing code base, and giving back to the community.
Since we know open source contributions can unlock opportunity, we pay attention to the rate at which students engage.
The trend across the board is an increase in engagement with open source projects. When compared directly, in 2019, 52% of respondents had contributed to open source. In 2020, 61.2% had contributed.
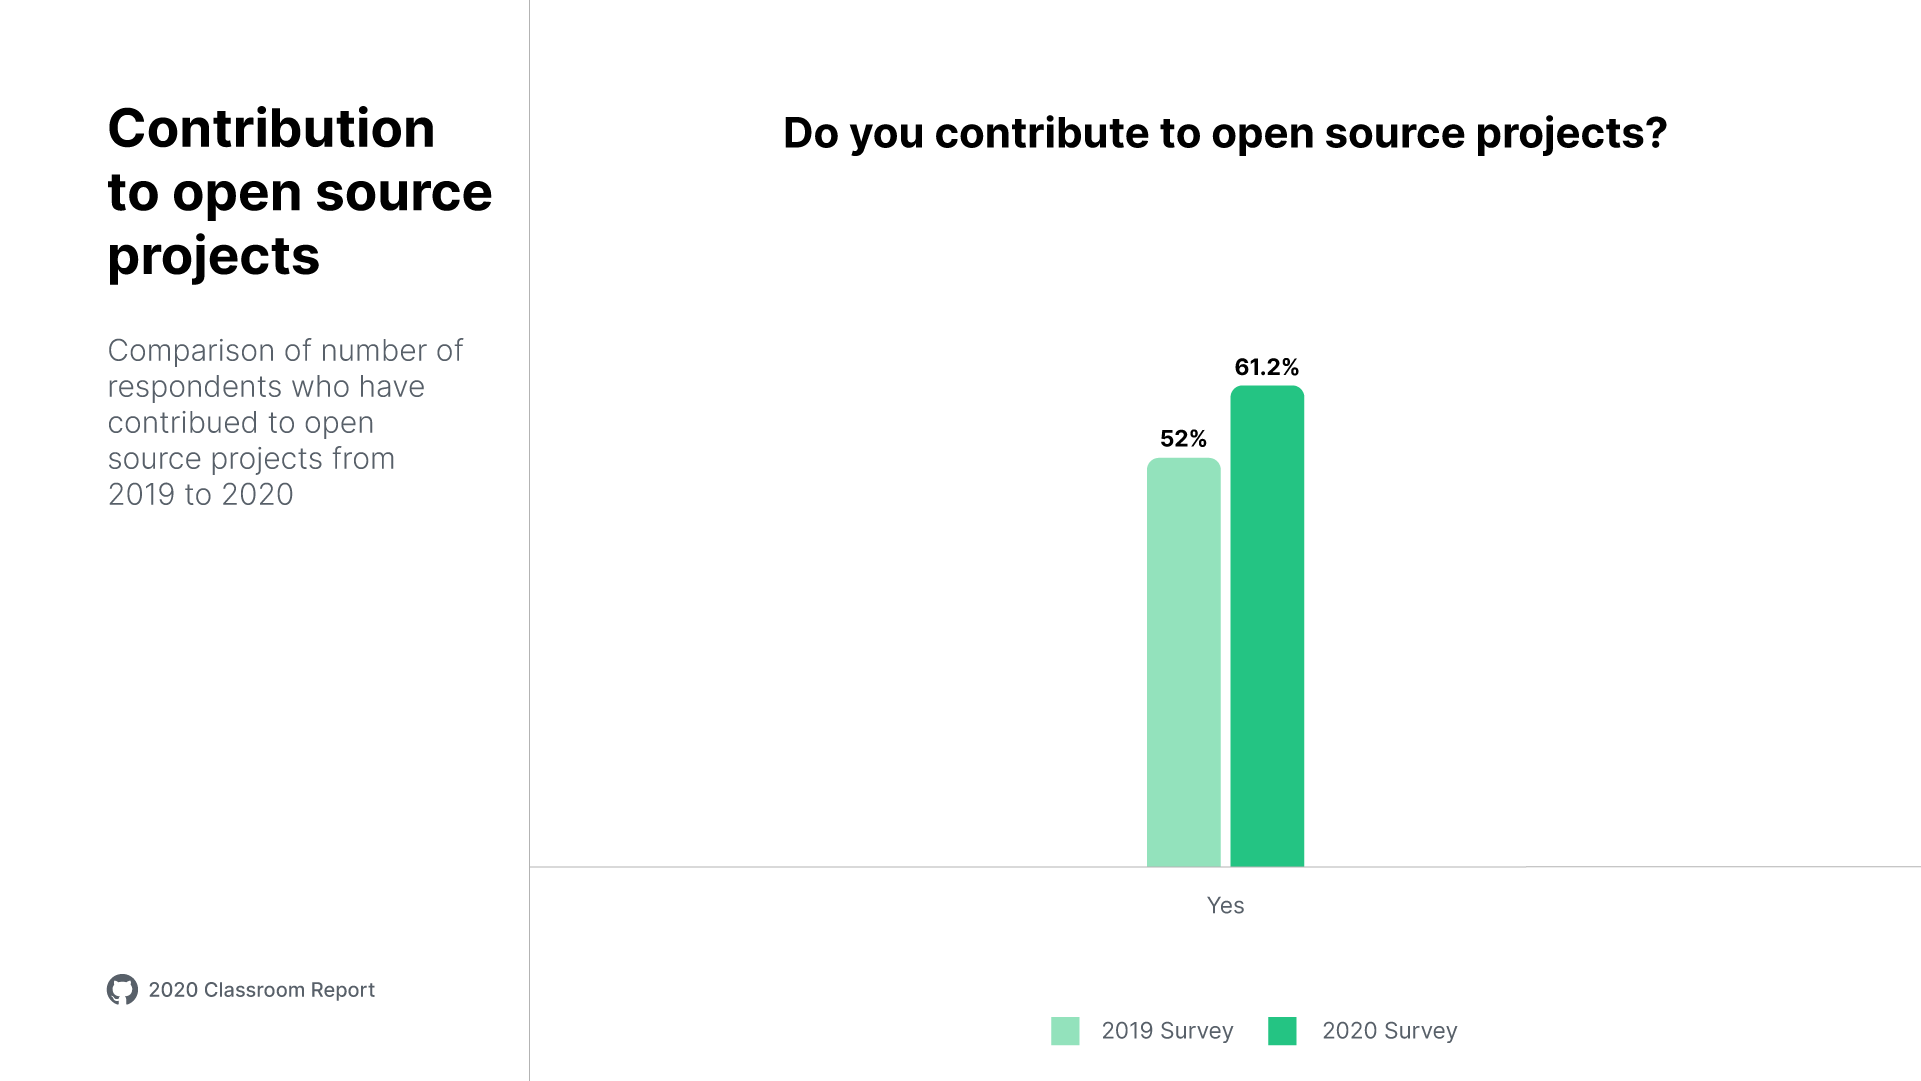
We're pleased to see this shift, and will pay closer attention to which levers young developers find inviting and effective. It could also be the case that, with a COVID-19-affected job market, more early-career developers are looking for ways to differentiate themselves. This finding is in step with this year's Octoverse Report. Usage data showed that developers as a whole, including students, spent more time engaging with open source software in 2020, especially on the weekends.
This year we saw meaningful shifts in behavior and mindset around contributions to open source. This is good news for organizations who rely on open source tools, or use open source projects as an engagement strategy to serve developers.
What the developers want in a workplace
Internships
Companies often rely on internship programs to recruit young talent and keep their brand relevant on campus. Of the 7,070 students we surveyed, 31.9% of them had a paid internship in the last year (and many had more than one!).
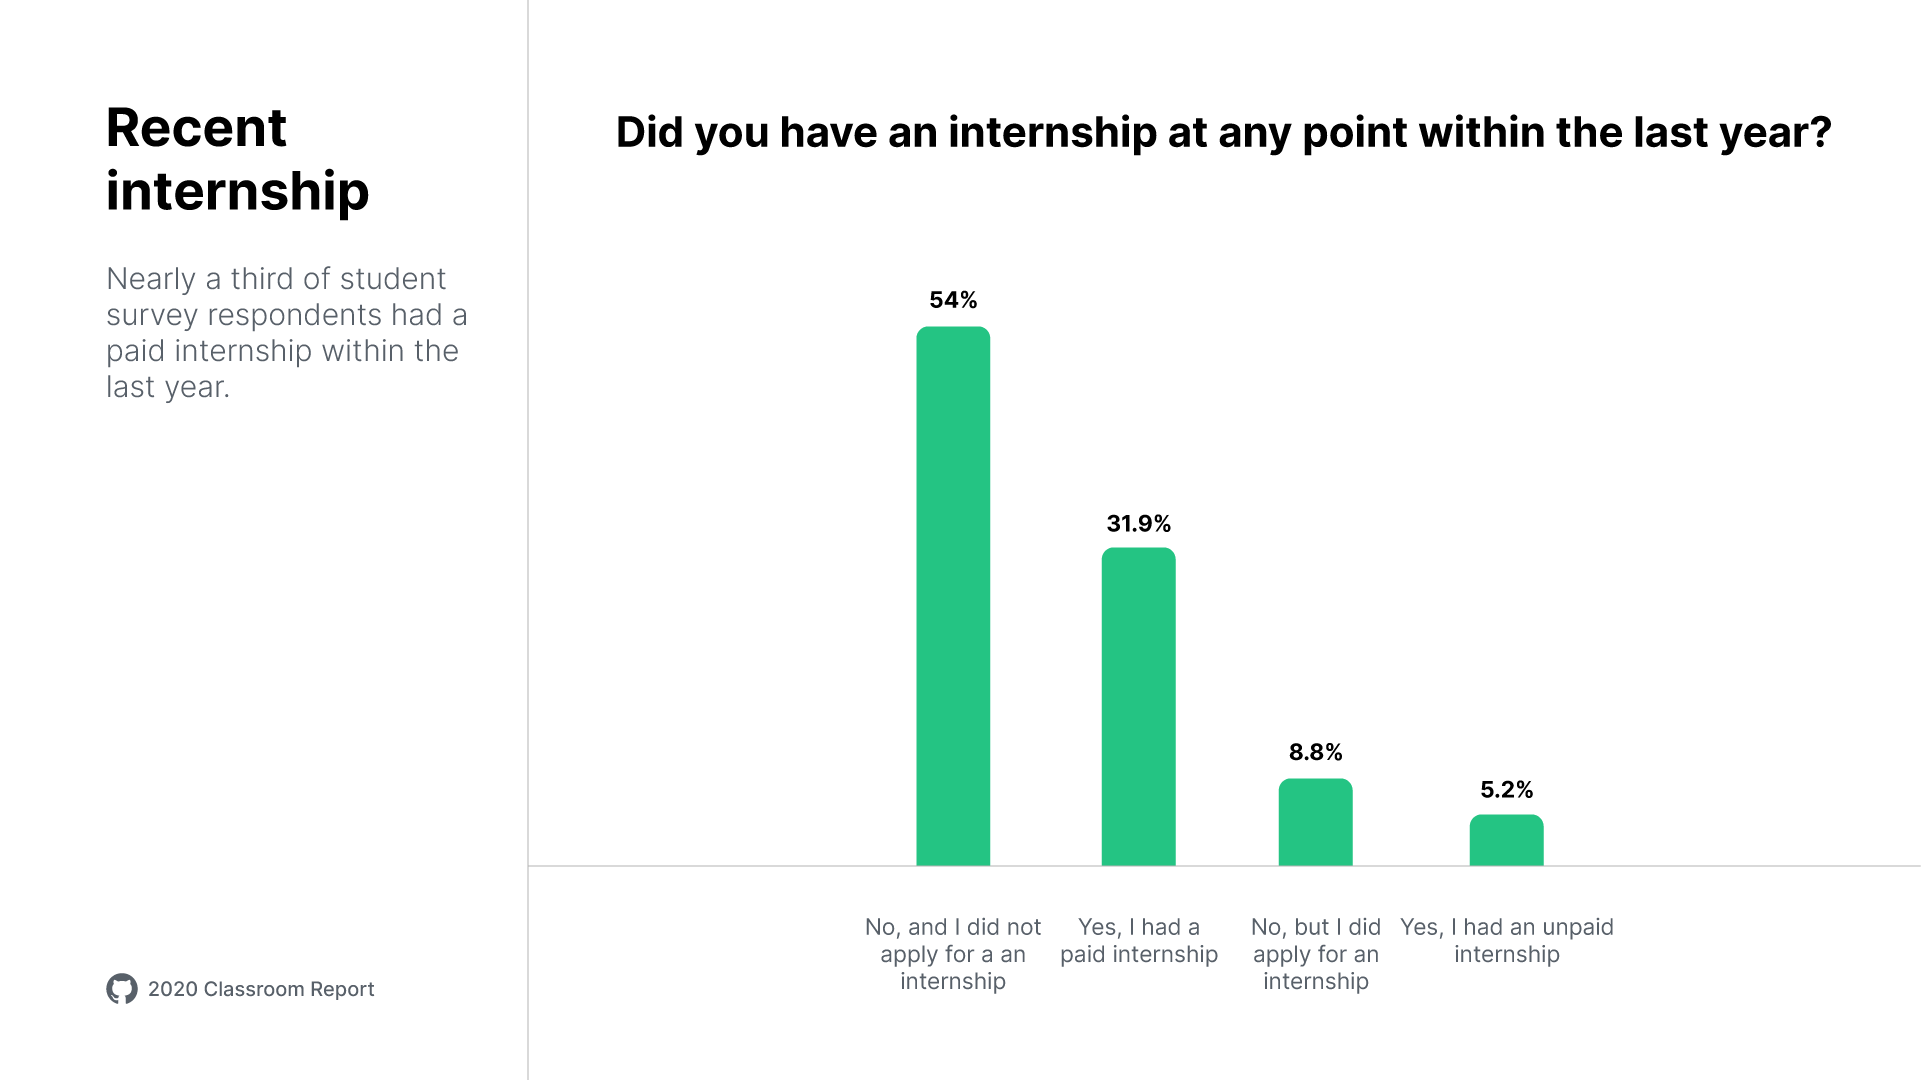
The internship market appears competitive, with students casting a wide net: on average, student respondents who had an internship applied for 19 positions, and received 2 offers. Even the students who did not receive a paid internship applied to 8 positions.
If you're a student, expect to dedicate significant time and energy applying to many roles (15 or more). Data indicate the more roles you apply for, the better your chances.
Internship preferences
The top attractions students are looking for in their internships? Well-compensated positions, real-world experiences, and opportunities to learn.
What surprised us about this data, as managers, is that interns have the ability to be discerning. They usually have multiple offers to choose from, with payscale as one of the top decision-making elements.
The path to full-time work
Of those who are employed, 20% of early-career developers work in large organizations with 10,000 employees or more, and 17% work in small business or startup environments with fewer than 10 employees.
However, when asked about employment status as a whole, we saw a signal that early-career developers are struggling to find full-time work.
What is your employment status?
| Employed full-time | Employed part-time | Independent contractor, freelance or self-employed | Not employed but looking for work | Not employed and not looking for work | Retired | |
|---|---|---|---|---|---|---|
| 2019 | 63.3% | 9.7% | 9.2% | 10.4% | 7.4% | .1% |
| 2020 | 50.4% | 14.7% | 10.2% | 15.4% | 9.1% | .1% |
While 44.7% of the respondents are still full-time students (vs. 29.8% in 2019), we see a rise in respondents who are not employed but looking for work. These market shifts may be due to economic conditions resulting from COVID-19, or GitHub's increased presence in areas that suffer from underemployment.
Organizations who do not offer internship programs may still want to connect with local colleges and universities to meet with students looking for their first role in industry. Our favorite example is Shopify's relationship with Carlton and York Universities, called DevDegree.
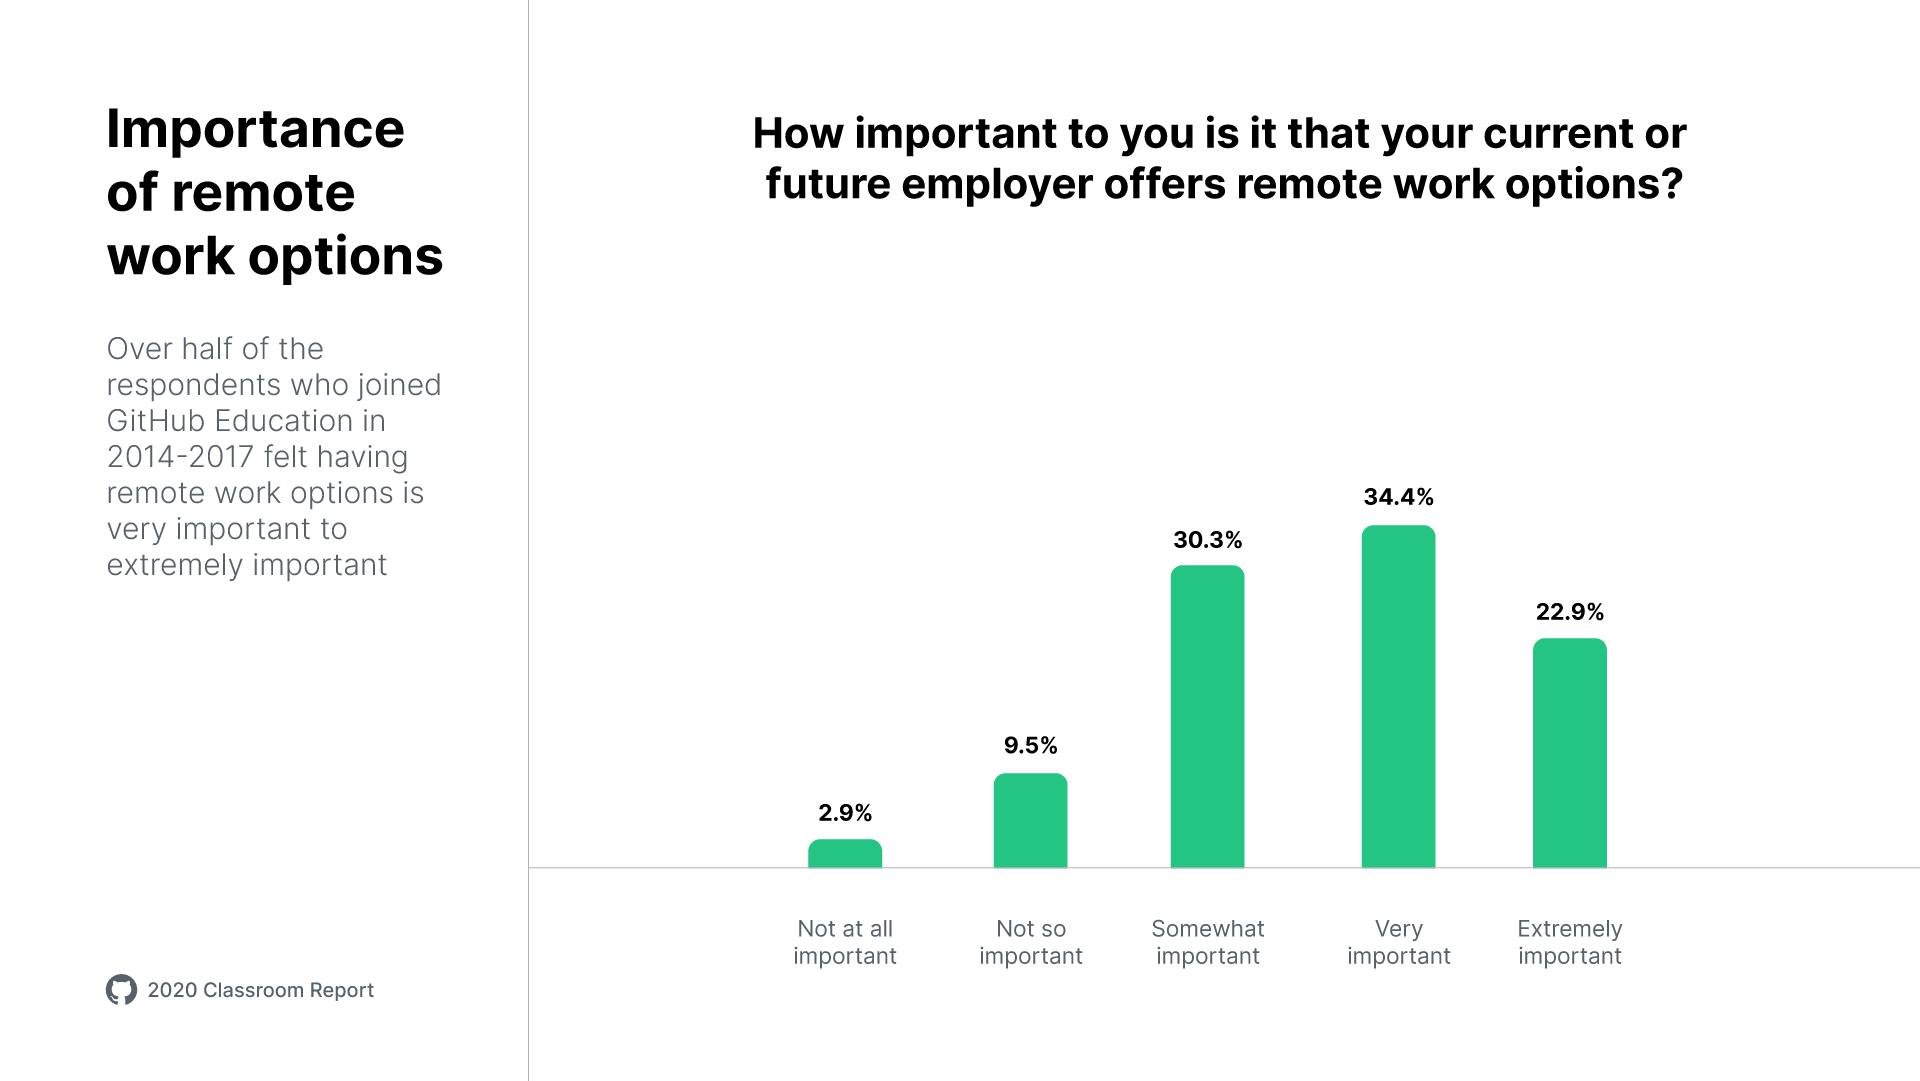
Expectation of remote work
Many in the technology world are fortunate enough to work remotely through COVID-19. Data indicate that early-career developers expect remote work to become standard operating procedure, moving forward.
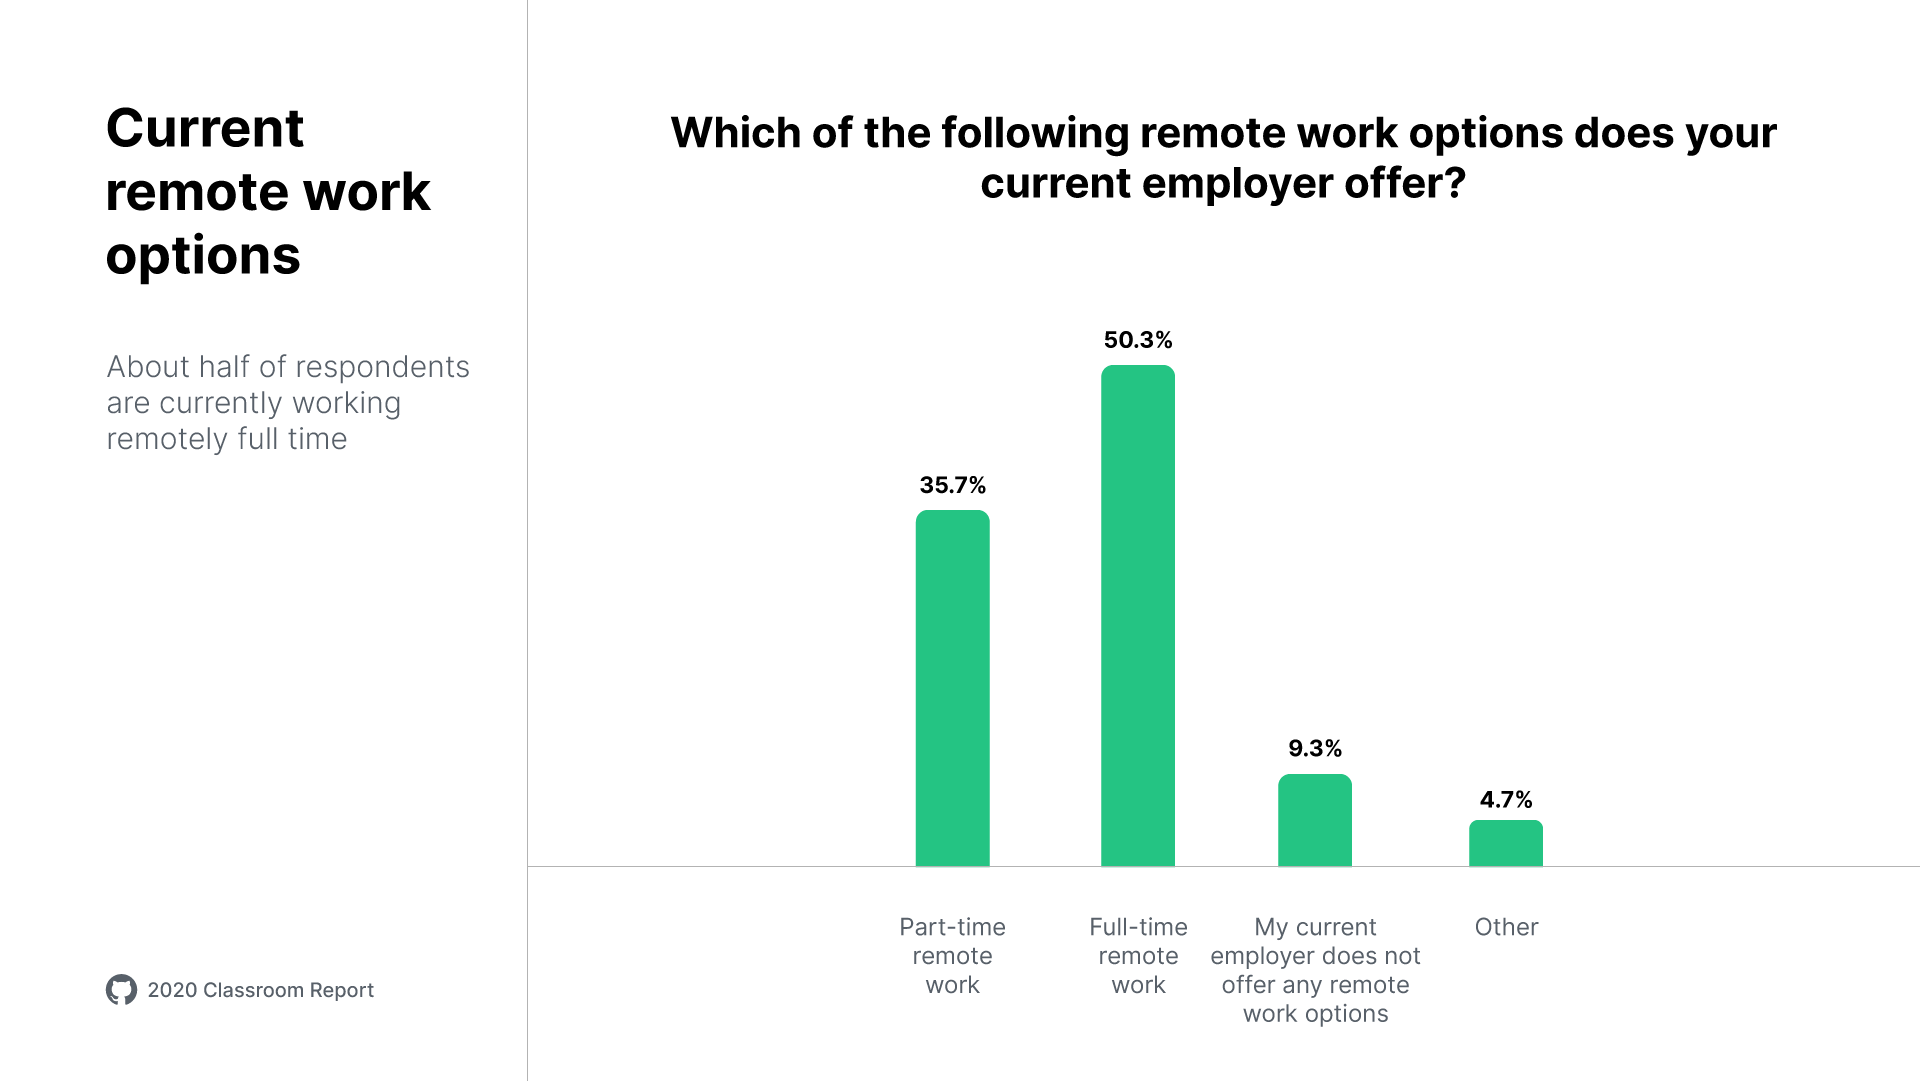
Of the respondents who selected “other,” many of them shared that their employer was only offering remote work temporarily due to COVID-19.
While we expected safety around COVID-19 to be the chief reason for preferring remote work, the array of responses surprised us, from saving the company money to climate change. Other reasons for expecting remote work include greater flexibility, more time back in their day from not having to commute, work-life balance, and higher productivity.
- “During COVID-19, it is important for my health and the health of my family to be able to work remotely.”
- “Reduce impact on the world with climate change. If I didn't have to commute I wouldn't really have a reason to own a vehicle and could get something more economical.”
- “It is important because I can organize my time in a better way, save transportation expenses, and save the company I'm working [for] from an unnecessary workspace.”
- “I like the flexibility of running errands during the workweek, taking care of family matters. Taking care of kids when sick.”
- “Because I have more time to spend with my family.”
- “I've learned that my productivity is much higher when I work remotely.”
At the same time, we know from managing early-career developers ourselves, remote work can be challenging for those in their first or second roles out of school. Younger developers are eager to grow through their professional network, get on-site mentorship, and connect with their cohorts at work. If early-career developers continue to choose remote work, that will be a challenge for the organizations who will need to provide that support in a different way.
For organizations without a recruiting arm or budget, lean into the story of your transition to remote work culture and unique benefits. Expect a shift in the way you think about developing and growing individuals, who might previously get mentorship and networking from on-site interactions.
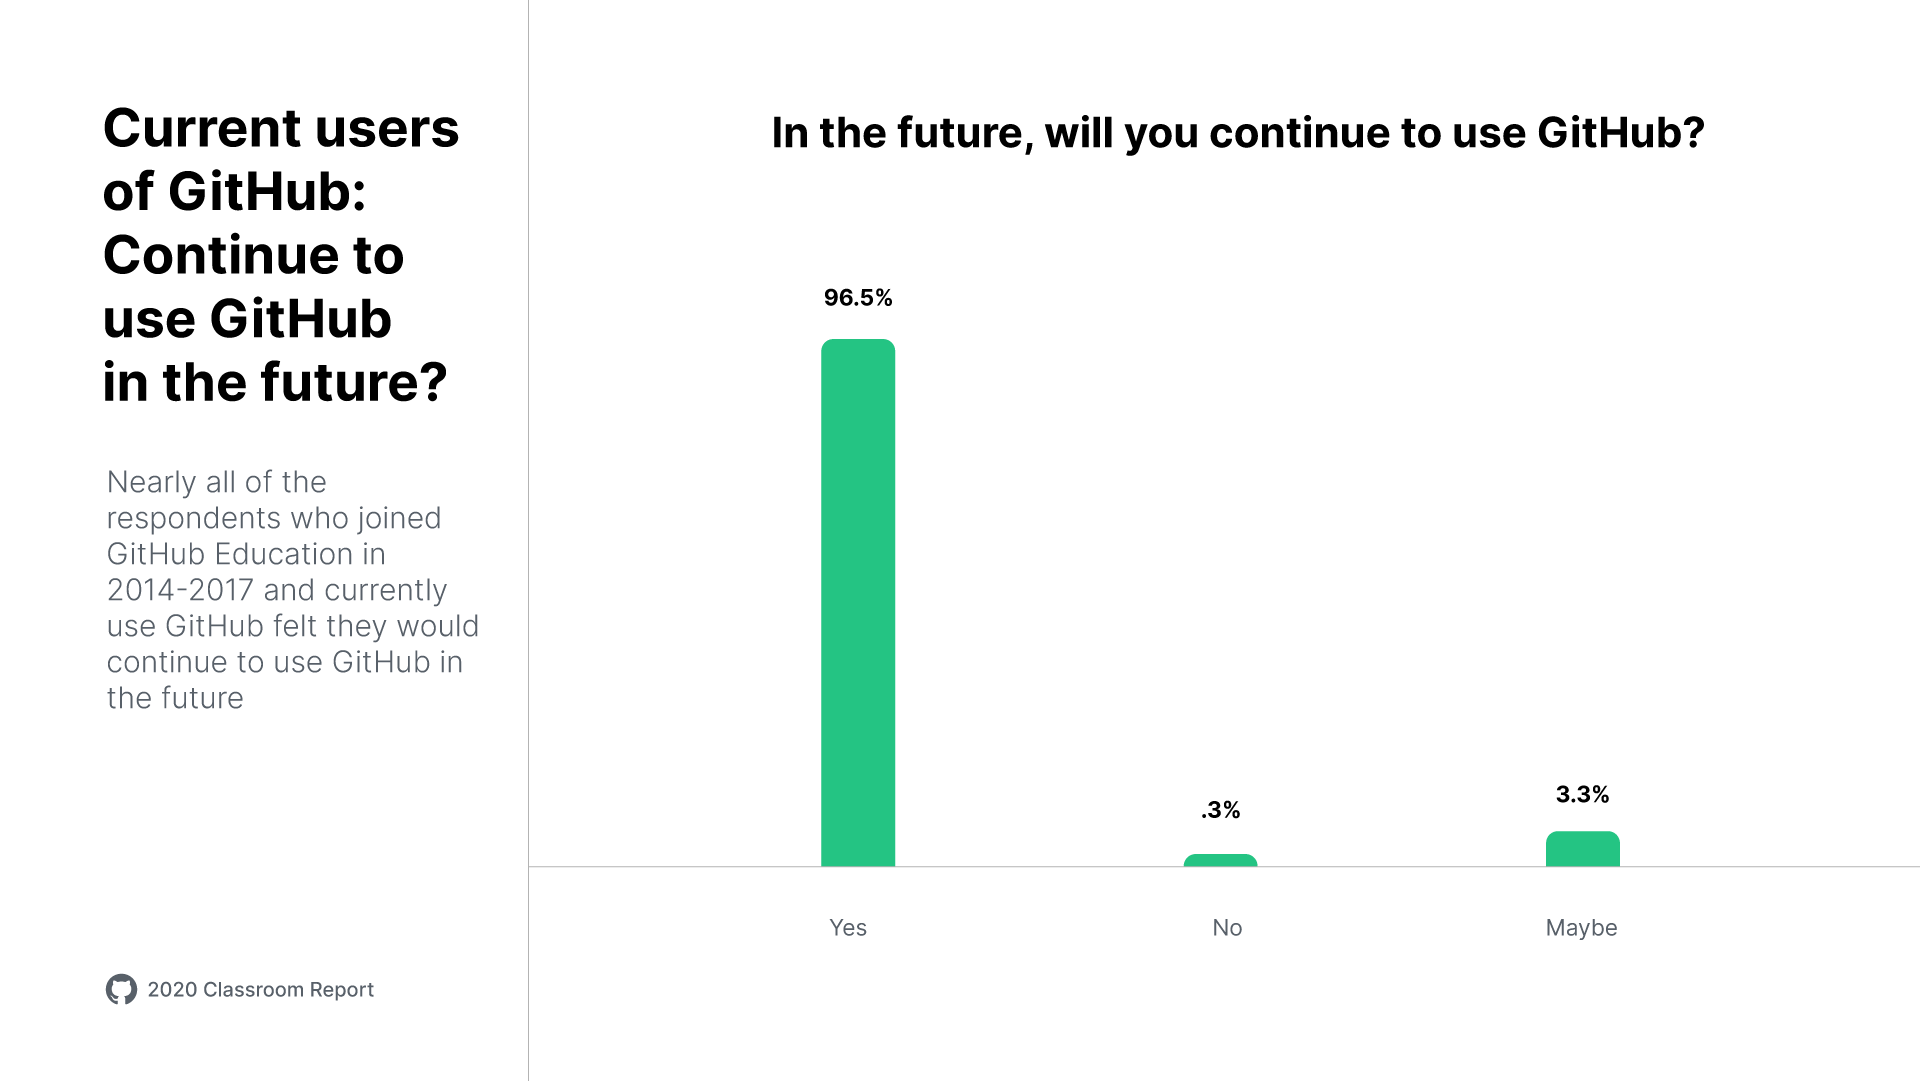
Early-career developers want GitHub
GitHub Education has served 2.5 million students over the past 8 years, and we're honored to help them make their best work. Last year we reported that our Net Promoter Score among students is 63--up there with brands like Apple, Samsung and Starbucks. The high regard for our product continues this year, even through challenging times.
Using GitHub for your company's workflow, or partnering with GitHub, may boost your organization’s appeal to early-career developers.
How students are learning in school
GitHub Education serves 53,000 faculty around the world at the secondary, university, and graduate levels. Of the faculty who responded to our survey, 54.7% had been using GitHub for more than five years. From our previous research on faculty usage patterns, we know they try new tools in their own research for a year or two before implementing them as part of coursework.
Version control in the classroom, as a learning tool, continues to become more prevalent among teachers. As one of the first data points we collected in 2017, we can compare across years. It's exciting to see faculty adoption of version control grow from 44% in 2017 to 73.3% this year.
| Count of faculty interviewed | Yes | No | No, but I would like to | No, and I would not like to | |
|---|---|---|---|---|---|
| 2017 | 172 | 44% | 56% | n/a | n/a |
| 2019 | 108 | 72.6% | n/a | 23.6% | 3.8% |
| 2020 | 165 | 73.3% | n/a | 24.2% | 2.4% |
Faculty usage of specific GitHub features remained, on the whole, pretty consistent with our findings from 2019, with the following outliers:
| Issues | GitHub Pages | Forks | Projects | Labels | |
|---|---|---|---|---|---|
| 2019 | 49.2% | 41.5% | 36.9% | 50.8% | 30.8% |
| 2020 | 57.5% | 49.1% | 45.3% | 33% | 24.5% |
GitHub Pages remains a popular feature for data storytelling, portfolio sites, or course-specific projects. Usage of Issues to track bugs, features, or feedback has risen as well. However, project management features such as Projects and Labels have decreased in usage, suggesting that faculty may be assigning less group work, or using alternative project management tools in the learning toolchain.
The Learning Toolchain
Much like the developer toolchain, faculty members select tools to distribute assignments, sustain engagement, and provide assessment. Unlike the individual developer who may tinker with a new tool, or try a new framework, faculty are often more deliberate and thoughtful about what to use in class. In a learning context, faculty members must balance the overhead of implementing the tool with the pedagogical value it provides to the student.
In light of that decision-making process, we're surprised to see changes in classroom tooling. This year we again asked about integrated development environments.
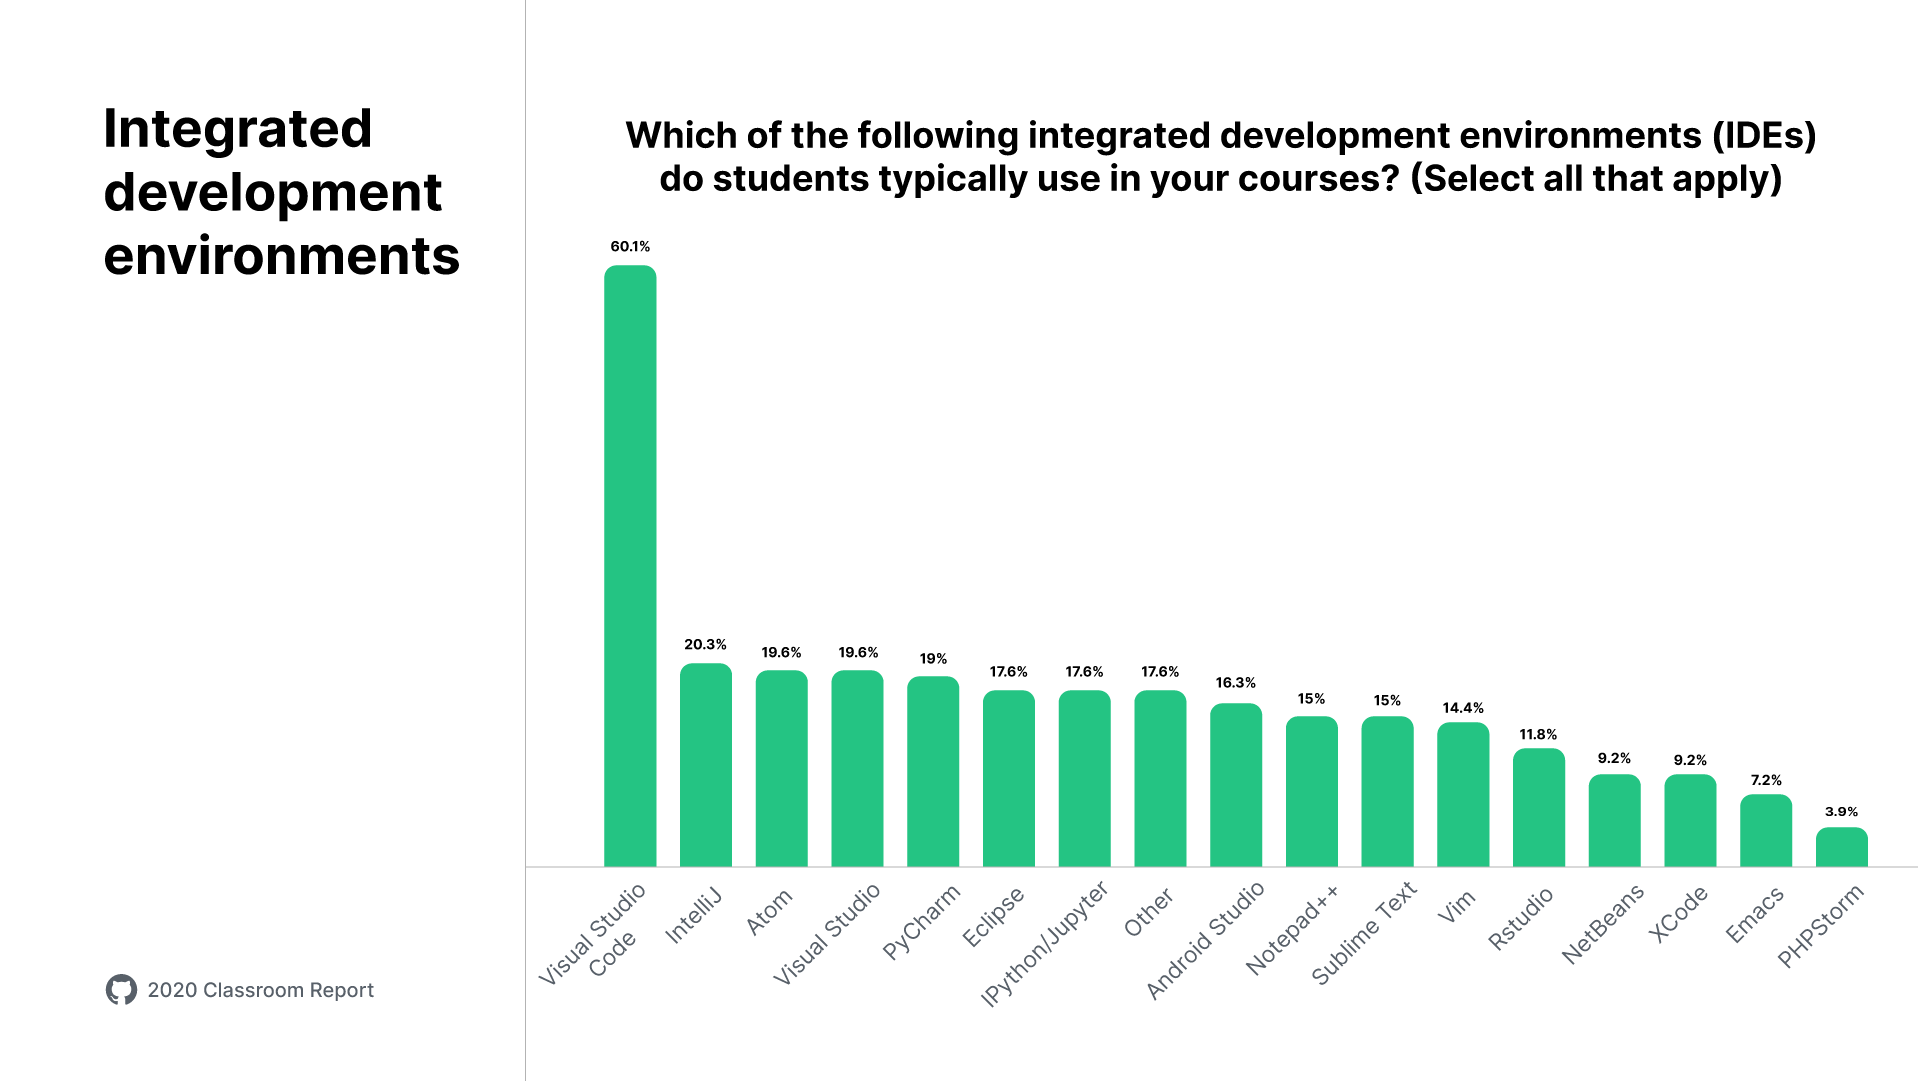
The most notable changes in usage happened across the following tools:
| Visual Studio Code | Sublime Text | Atom | Vim | Android Studio | |
|---|---|---|---|---|---|
| 2019 | 41.7% | 25% | 26% | 21.9% | 22.9% |
| 2020 | 60.1% | 15% | 19.6% | 14.4% | 16.3% |
Visual Studio Code has gained significant adoption among faculty from 2019 to 2020, and language-specific and powerful IDE's like PyCharm, IntelliJ, and Eclipse remain popular choices. Sublime Text and GitHub's own Atom saw the most marked drops in usage.
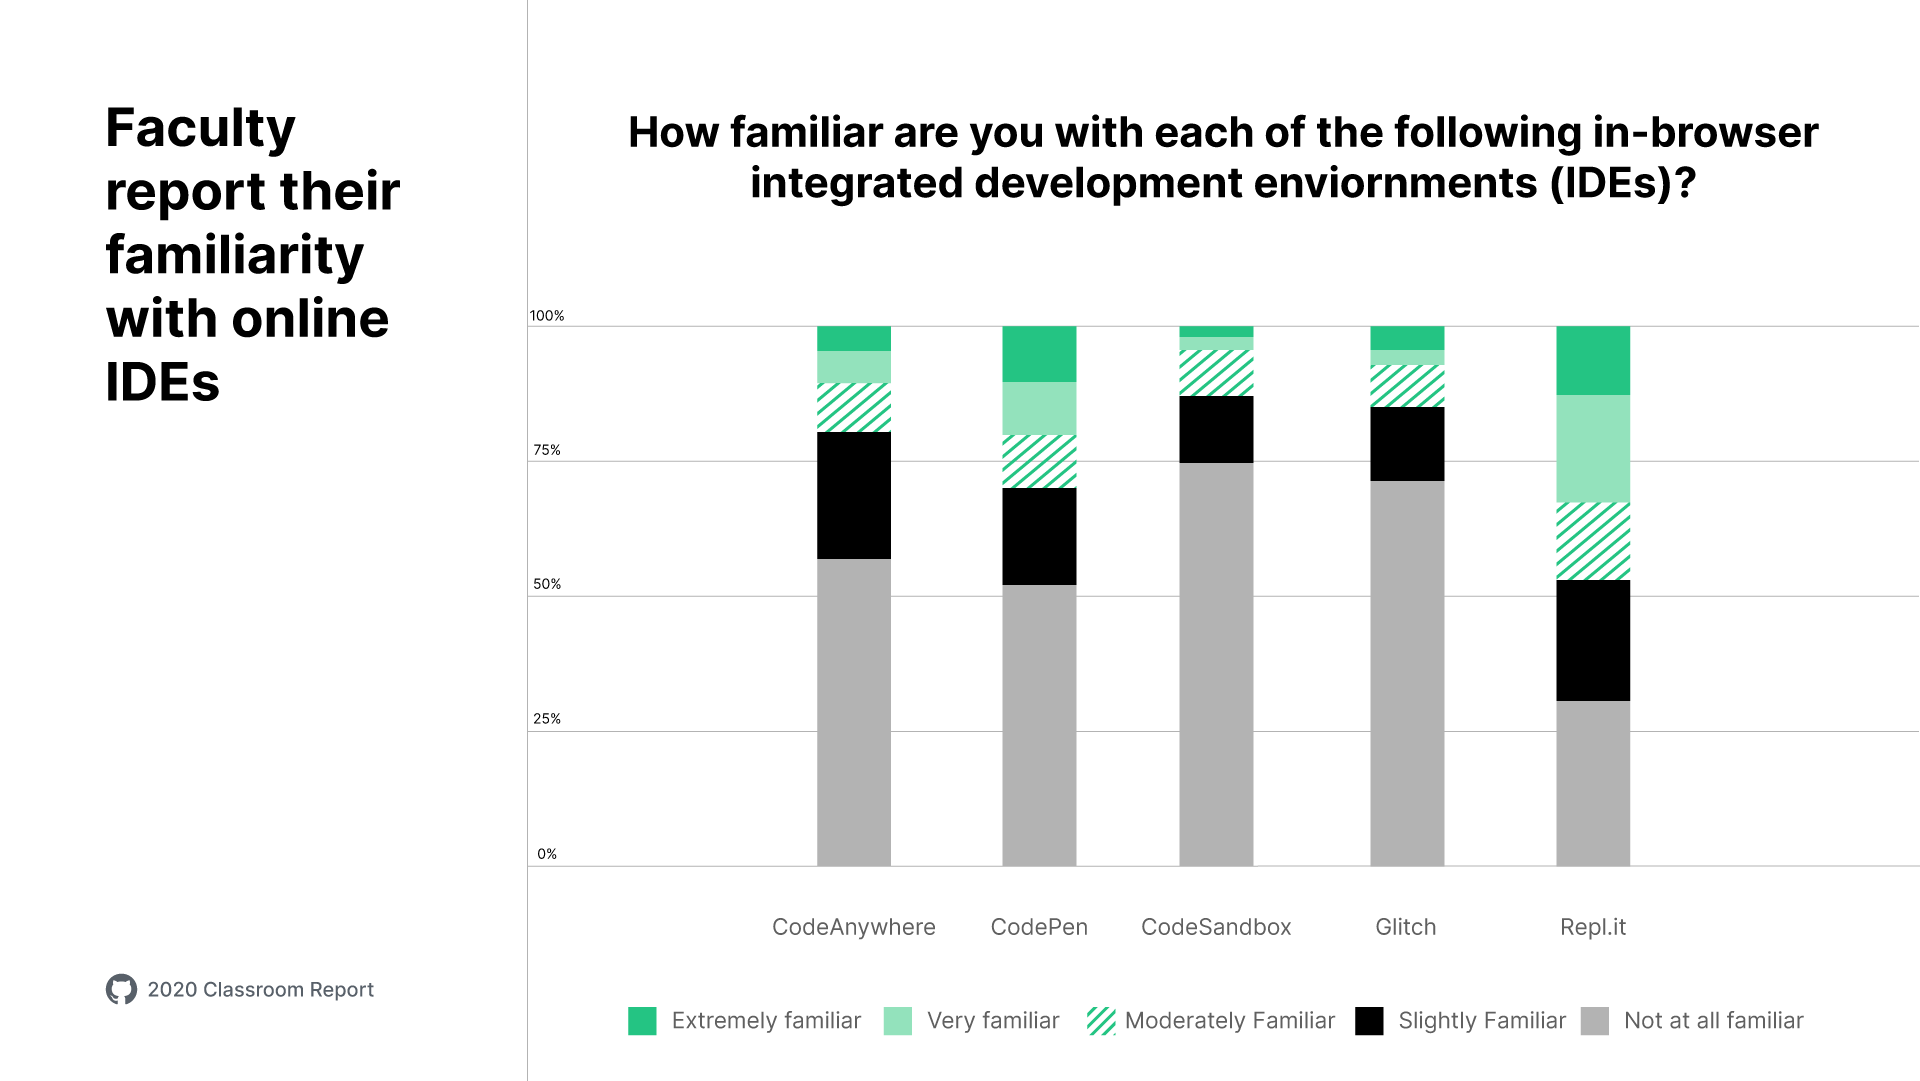
And like students, who use browser-based tools for their ease of use, more than 50% of teachers have written code via a browser based tool. Repl.it stands out as the first choice of faculty.
Teaching in the era of COVID-19
Faculty carry a heavy and heartbreaking burden at the moment: trying to serve their students in an unexpected virtual classroom. Over ¾ of our faculty report they adjusted their courses at least a moderate amount to accommodate online teaching, and many see more of the same in the spring. 87.7% of them expect to teach online again in the next six months.
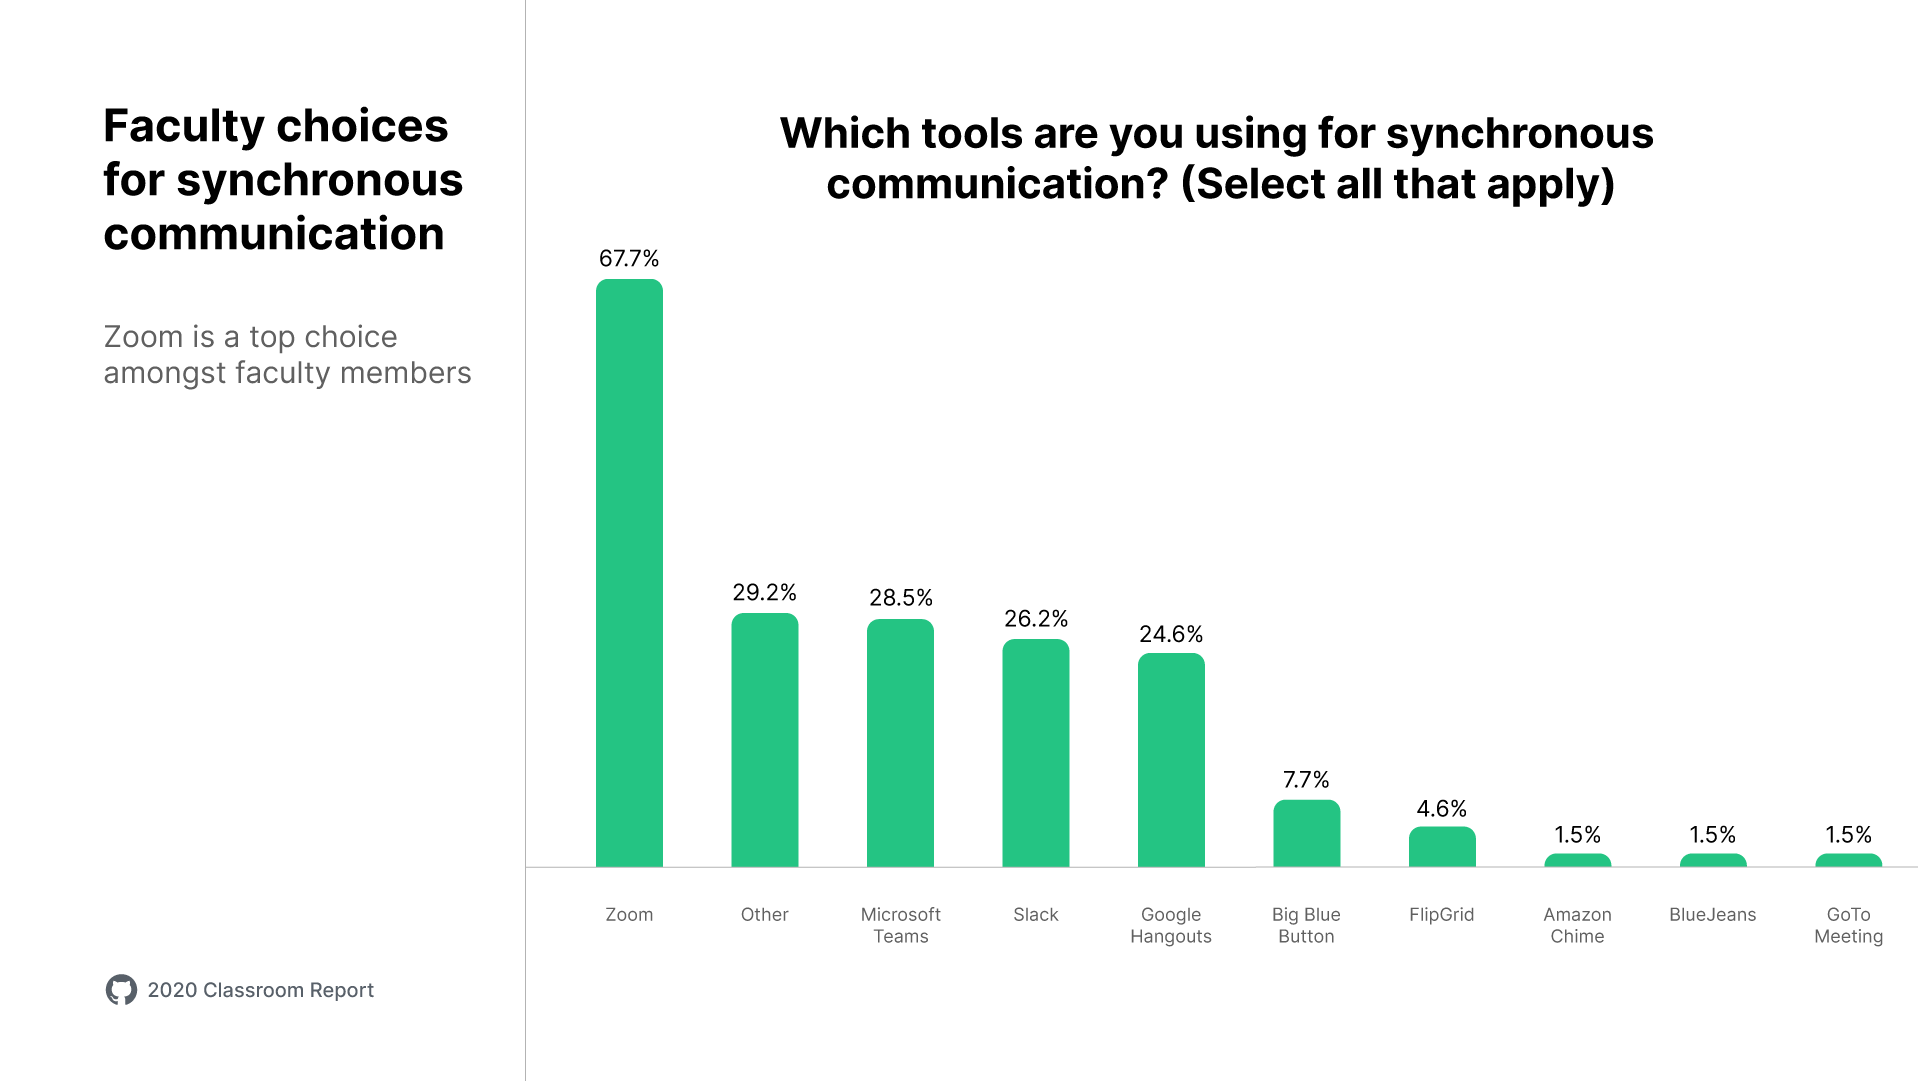
The current challenge, they say, is student engagement. While many use Zoom (67.7%), faculty struggle to bring the material alive in the same way as an in-person class.
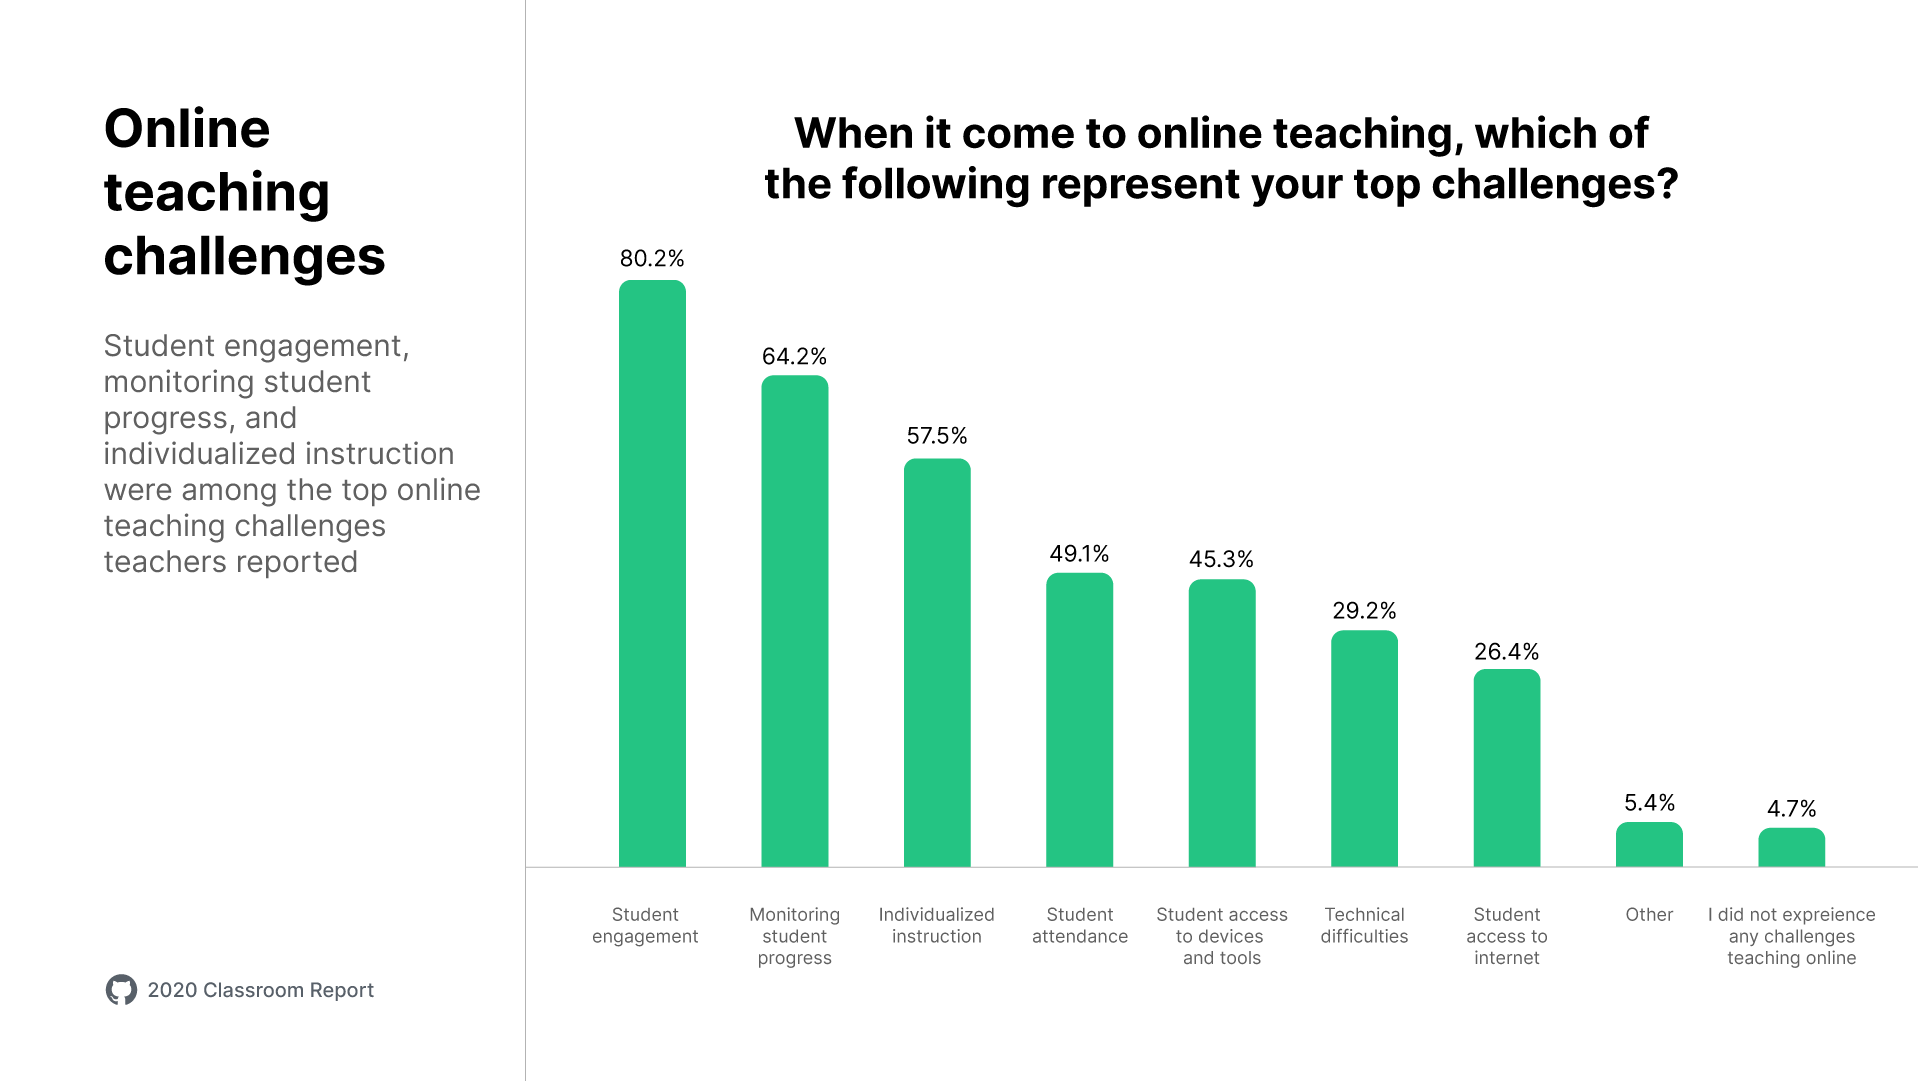
Since education is changing, preferences in tooling are also changing. Faculty are looking for help and support with student engagement, and ways to intervene when students struggle.
How to serve the next generation of developers
For faculty
We're here to help you automate your coursework, distribute assignments for virtual classrooms, and all of our tools are offered at no cost.
- Curious about using a browser-based IDE? Here's a demo.
- Save time with autograding from GitHub Classroom. See how it works.
- Try real-world tools in the classroom with the Teacher Toolbox.
For organizations
If you are looking to reach the next generation of developers, we have a few ways to collaborate.
- Connect with young talent. The MLH Fellowship, powered by GitHub, offers organizations a way to train early-in career developers on best practices, contribute to open source, and build their pipeline.
- Support open source. GitHub Sponsors is a way to support the sustainability of the software we all depend on.
- Build a strong work culture. This year's State of the Octoverse Report has key insights--based on actual GitHub usage--on productivity, work habits, and where the industry is going.